
Dual Time Frame MACD Indicator
MT4Also Available for MT5Dual Time Frame MACD Indicator For MT4 plots MACD of the current forex chart time frame and the next higher one. Best multiple MACD for trend confirmation
Description
The Dual time frame MACD indicator for MT4 plots MACD lines of the current chart time frame and the next higher one. It plots both of them in the same indicator window. As a result, forex traders can identify the MACD trend direction of both at a glance and buy or sell accordingly.
The indicator works well in all chart time frames, however it is important to note that higher time frames tend to provide better trading results. Additionally, the indicator is suitable for auto trading strategies.
Dual Time Frame MACD Indicator For MT4 Trade Setup
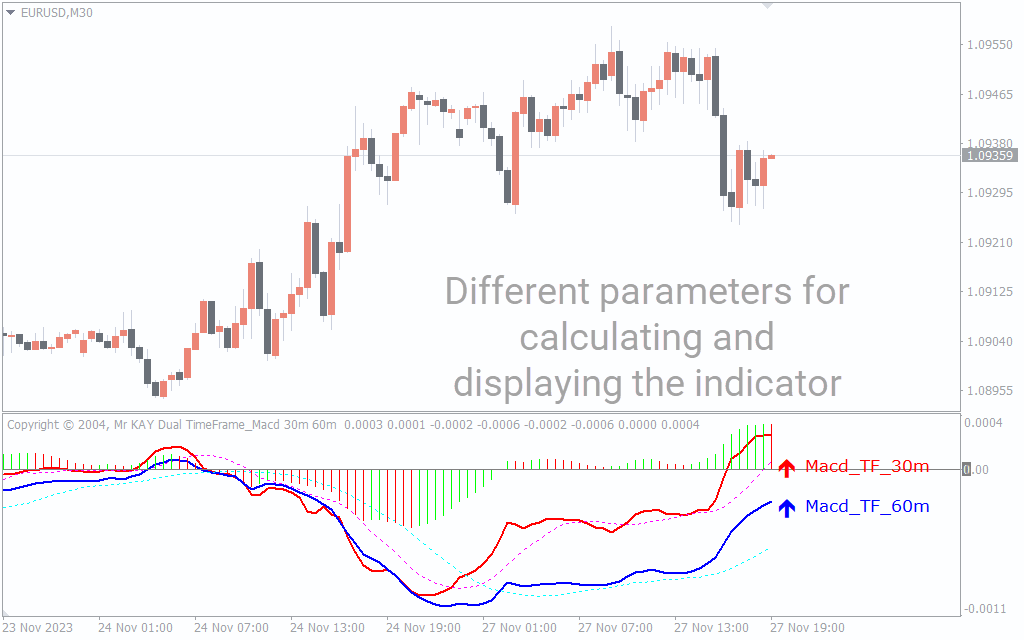
The indicator plots the MACD with histogram bars of the current chart time frame. Furthermore, it plots the MACD and signal line of the next higher time frame. There are multiple trading strategies using this indicator.
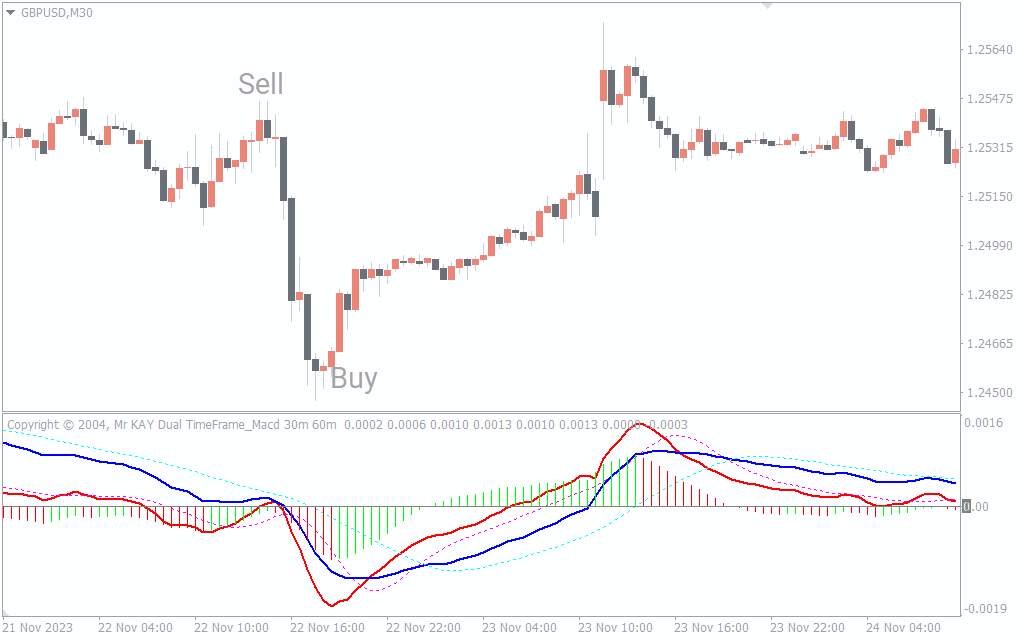
Generally, traders use the MACD Zero line crossover of the histogram bars to identify the bullish and bearish price trend. However, traders make sure that the higher time frame trend direction corresponds to the current one.
Alternately, aggressive forex traders buy or sell based on the crossover over of the MACD line and signal line. For additional confirmation traders should look at the higher time frame MACD trend direction.
Another trading strategy is to enter the market based on the crossover of the lower time frame MACD line and the higher time frame MACD line. In effect the blue line represents the higher time frame and the red one is the lower time frame MACD. If the red line crosses the blue line upwards it is a bullish trend. On the other hand, downward crossover of the red line against the blue line is bearish.
Conclusion
In summary, the dual time frame MACD indicator for MT4 is an essential tool for forex traders using multiple time frames of MACD to identify the trend.

1 2 3 4 5