
Hurst Bands Indicator
MT5Also Available for MT4The Hurst Bands indicator displays dynamic support/resistance levels. Finds exact buy/sell positions on MTF charts. The best MT5 indicator for forex and stock trading.
Description
The Hurst Bands indicator identifies dynamic support-resistance levels and helps traders evaluate the best trading opportunities on pullbacks on MTF charts.
From a technical standpoint, Hurst Bands is a versatile MT5 indicator that can be used to track market highs and lows to determine current price trends. At the same time, it highlights potential retracement levels so that traders can pinpoint buy/sell zones. However, this is not an automatic trading signal generator. Traders analyze the price behavior around the channel levels and evaluate buy/sell opportunities based on the formation of price candles.
In this guide, we will explain how the Hurst Bands Indicator for MT5 helps you make the best Forex and Stock trading decisions, including sample charts.
How to spot accurate buy-sell zones by using the Hurst Bands Indicator in MT5
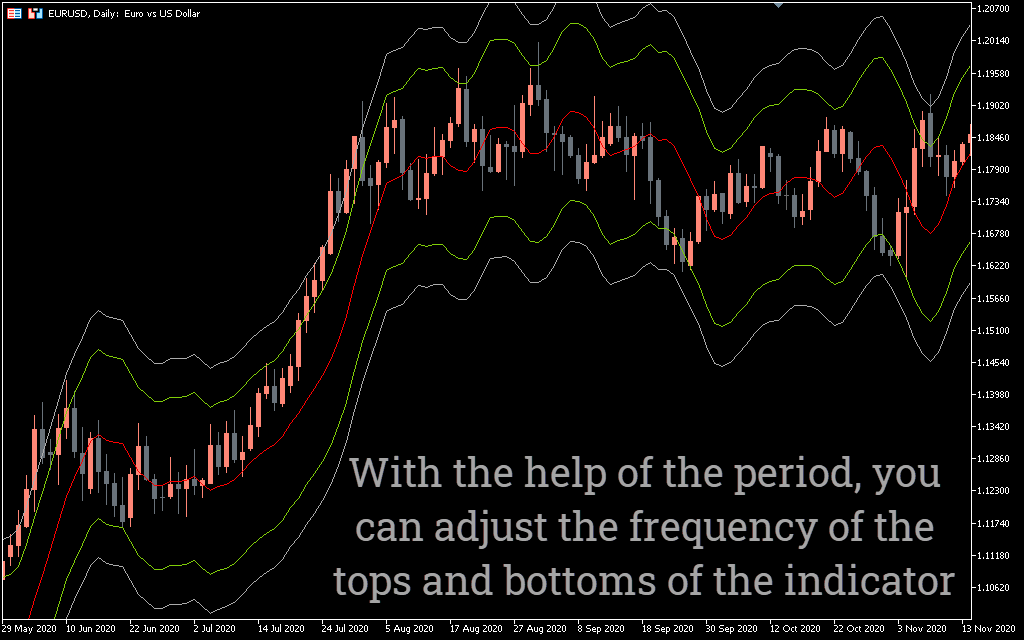
The Hurst Bands indicator builds a seven-band price channel showing the nearest support/resistance zones and a dynamic trend line. You will evaluate price action around channel levels to anticipate upcoming market movements.
For example, during a bullish market trend, the price usually refuses to break below the lower channel. In addition, the price will tend to stay above the center line until the market switches to bearish momentum. On the contrary, in a downtrending market, you will find that the price deviation exceeds the upper channel and mostly holds below the middle channel level.
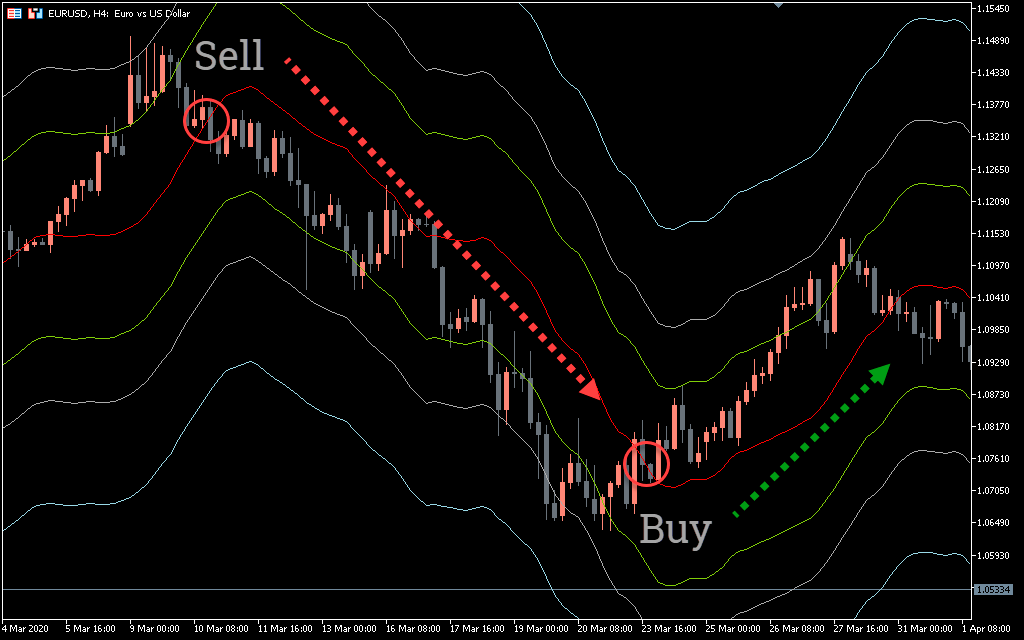
In the example above, EUR/USD initially rejected a move above a higher channel, indicating a potential bearish move. Later, the price formed a large bearish candle that broke below the middle of the channel, confirming the downtrend. So be prepared to go short whenever price makes a lower high and rejects channel resistance. Then open a short position as soon as the price breaks the level of the middle of the channel.
Similarly, we can target a long entry if the price does not move below the channel support. For better confirmation, wait for a few bullish reversal patterns between the middle and lower levels of the channel. As you can see in the chart above, the price has formed a false breakout pattern at the channel support level after the end of a strong bearish move. Later, a large bullish pin bar appeared above the lower channel, indicating bullish momentum in the market. Thus, we can open a long position after the price exceeds the level of the middle of the channel.
In addition to entering a trade, the Hurst Bands indicator also helps to identify potential stop loss levels. For example, you can place a stop loss below the lower channel when entering a long position. Conversely, set your stop loss above the upper channel as soon as you go short.
Conclusion
The Hurst Bands indicator is the best automatic price level analysis tool for MT5. It helps track the highs and lows of the market, and its dynamic trend line support/resistance levels help determine the current state of the trend. Use it in conjunction with other MetaTrader price reversal indicators such as Stochastic Oscillators, MACD and RSI for better confirmation of buy/sell signals.
1 2 3 4 5