
Tipu Parabolic SAR Panel Indicator
Determine trend reversal positions, dynamic support-resistance, and intraday price breakout levels using the best trend-following MT4 indicator in MTF charts.
Description
The Tipu Parabolic SAR Panel represents a trend-following price-level indicator for MT4. It shows parabolic support/resistance levels and intraday price breakout zones on MTF charts. Price level analysis is a must-have skill for technical traders, especially in forex and stock trading. Both dynamic and fixed support-resistance levels guide traders through key price action events.
With the indicator, you can track price movements using trailing S/Rs. Also, you’ll know where to place your intraday buy-sell orders. Read through the guide to learn more about how the Tipu Parabolic SAR trading strategy works on MT4.
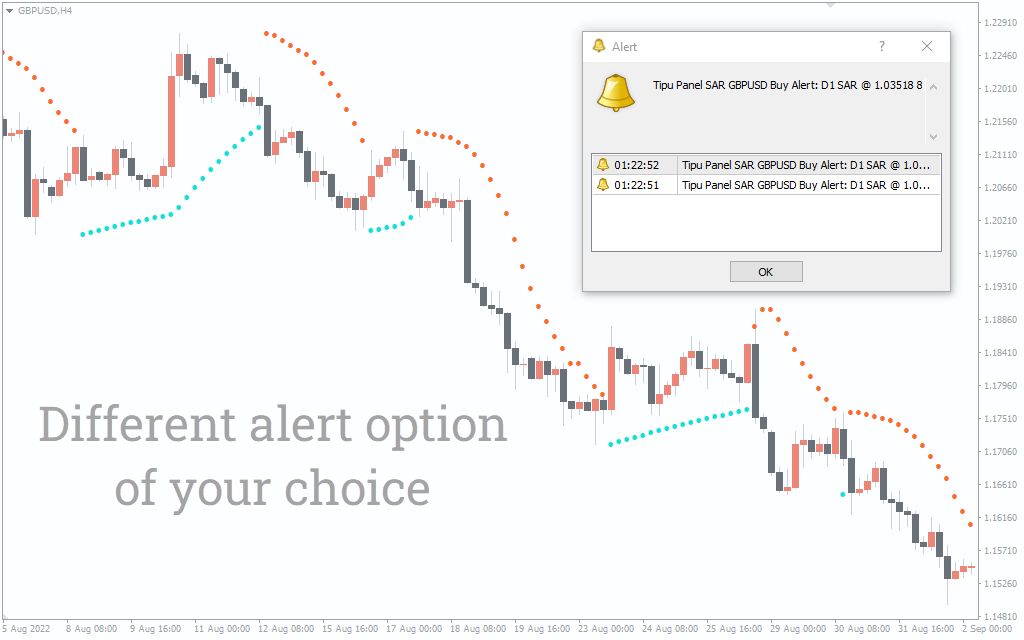
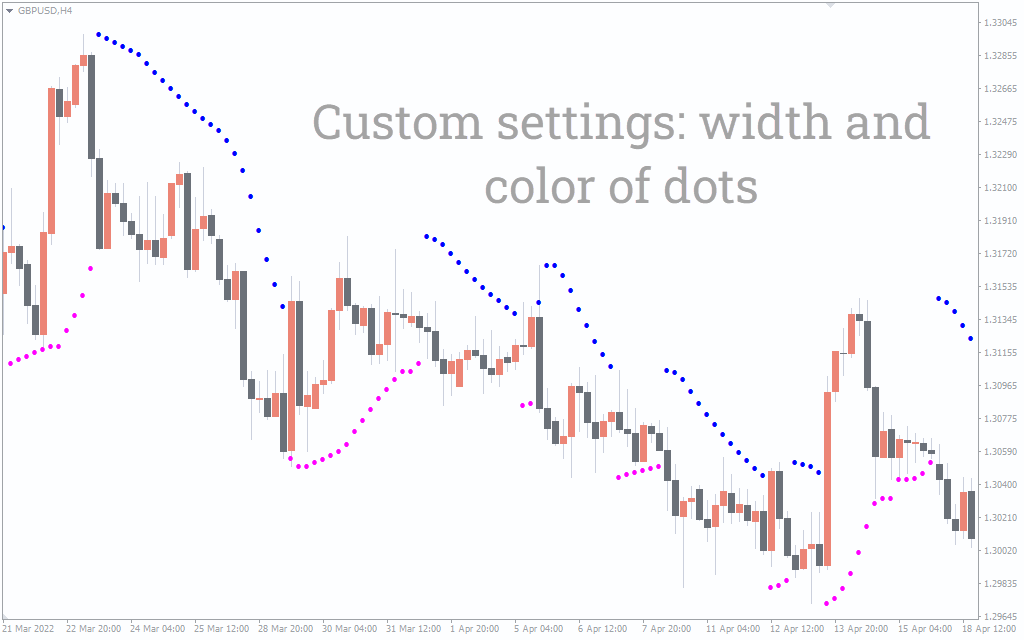
How to trade using the Tipu Parabolic SAR Panel indicator for MT4
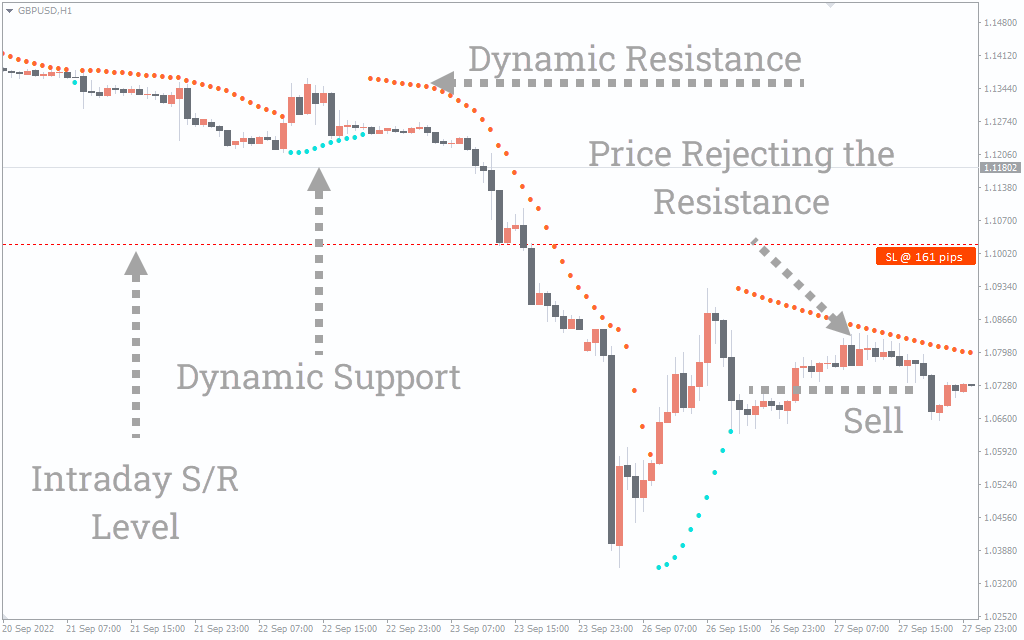
The indicator uses the blue dotted line as support and the green dotted line as resistance. These levels also point to the trend reversal positions of the price. The green horizontal line distinguishes the buy-sell zone. Enter buy when the price exceeds both horizontal and dynamic resistance.
In the same way, the price moving below the parabolic and intraday support means it is time to activate the sell order. The SL tag on the right side of the chart shows the possible stop-loss range based on the current price position.
Conclusion
Technically, the Tipu Parabolic SAR Panel is a versatile MT4 trading indicator. It offers dynamic support/resistance, trend reversal signals, and intraday price breakout positions. It lets you simultaneously look for buy-sell zones in forex and stock markets in all trading sessions.