
Jurik Volty Bands Separate Indicator
The Jurik Volty applies overbought & oversold bands with trend-following moving averages to spot solid buy-sell signals. Includes arrow signals and sound alerts.
Description
The Jurik Volty Bands Separate represents a momentum-based day trading indicator for MT4. It shows buy-sell arrows and trend reversal signal dots on the main price chart. Also, it includes a momentum oscillator showing overbought/oversold signals using dynamic volatility bands.
This indicator is quite exceptional compared to regular trend analysis tools. Typically, the OB/OS indicators use fixed parameters to identify changes in price trends. It applies dynamic parameters, automatically adjusting the indicator’s sensitivity to price action changes.
Furthermore, the Jurik Volty Bands Separate indicator suits all the MetaTrader 4 timeframes. However, applying it on hourly and higher timeframes is preferable for more consistent results. This guide explains how to trade forex and stocks using the indicator in MT4.
How to Anticipate Buy-Sell Signals Using the Jurik Volty Bands Separate MT4 Indicator
The Indicator signal line demonstrates the changes in the indicator value. During overbought markets, the value will hit the higher band. Conversely, value drops to the lower band will indicate an oversold market.
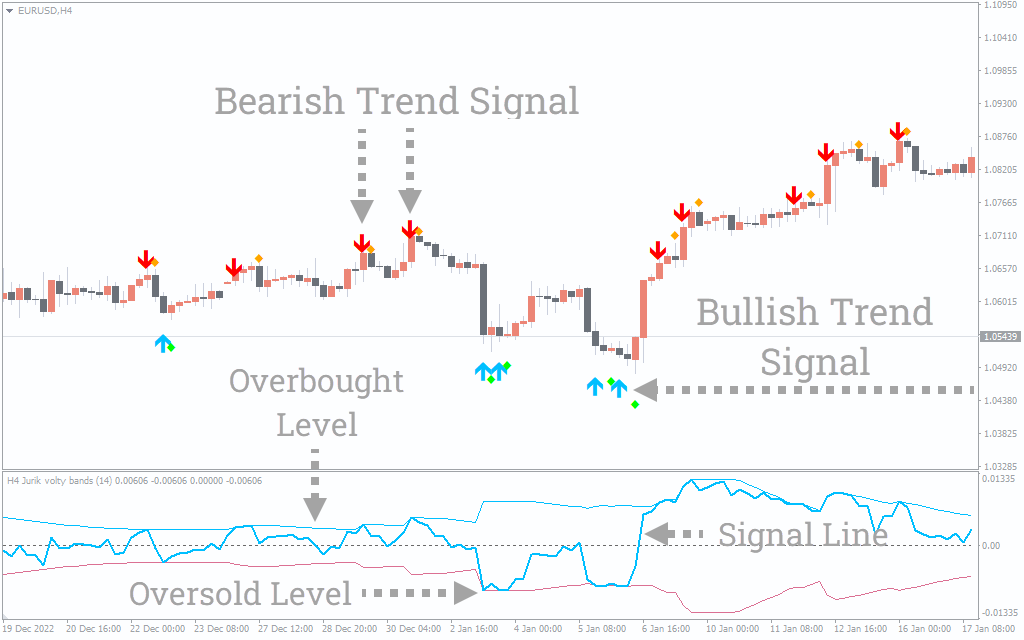
Whenever the indicator line hits a higher or lower Jurik Volty Band, it shows a blue/red arrow. Consider it as a primary trend confirmation. If the signal line hits an overbought/oversold zone twice, the indicator delivers a dot signal, ultimately confirming a potential trend reversal. So, once you counter an arrow signal, check if the price rejects or exceeds a solid support/resistance zone. Once the arrow, dot, and price action signal the same trend, we can only decide on a possible buy-sell entry.
For example, the price rejecting support while the Indicator delivers a blue arrow and a green dot below the price candle means an ideal setup for entering a buy order. You can consider a buy-exit after the signal line rebounds from the overbought zone. Besides S/R levels, an additional momentum or trend indicator can also guide you through strong trade signals. Suppose you’re not using a horizontal support/resistance. In that case, the moving average can be an ideal option for creating a trend-based trading strategy with the Jurik Volty Bands Separate indicator in MT4.
You can do scalping using the Jurik Volatility Bands arrow indicator. The gauge performs best in a market that ranges, allowing you to observe all price highs and lows.
Conclusion
The Jurik Volty Bands Separate is one of the most beginner-friendly indicators for anticipating trend-following buy-sell signals in MT4. It enables you to move freely to MTF charts and look for highly probable trading opportunities in forex and stock markets. Consider recent market highs/lows and horizontal support-resistance levels with Jurik Volty Bands Separate trend signals for better results.

1 2 3 4 5