
Breakout Panca Eagle Indicator
Breakout Panca Eagle Indicator For MT4 plots a breakout box based on high and low between 0.00 to 23.00. Forex indicator for Asian session breakout strategy
Description
The Breakout Panca Eagle Indicator for MT4 plots a breakout range based on the daily high and low from 0.00 to 5.30 hours. Forex traders anticipate that the price breakout direction from this high and low will continue for the rest of day. However, traders keep an eye on price reversals and consider breach of high and low of this box as a trading opportunity. For those who like trading with breakout systems, we also offer the Forex Breakout Box Indicator and the SQ Dynamic Breakout Box Indicator, which complement this tool with slightly different approaches to breakout detection and confirmation.
When I first installed the Breakout Panca Eagle on my MT4 platform, the process was very straightforward — just drop the file into the indicators folder, refresh, and attach it to the chart. The colored boxes appeared instantly, and what I appreciated was how visually clear the levels were. Personally, I found it especially useful on GBP and JPY pairs, where the Asian session ranges often provide strong setups. In my own testing, I noticed that combining the indicator with volume or candlestick confirmation reduced false breakouts and helped me filter trades with higher accuracy.
The indicator is simple and easy to trade for new and advanced forex traders. Though the indicator derives the high and low value between the specified times, it works on all chart time frames. Furthermore, the indicator is suitable for intraday trading and may not be applicable for long term trading.
Breakout Panca Eagle Indicator For MT4 Trading Signals
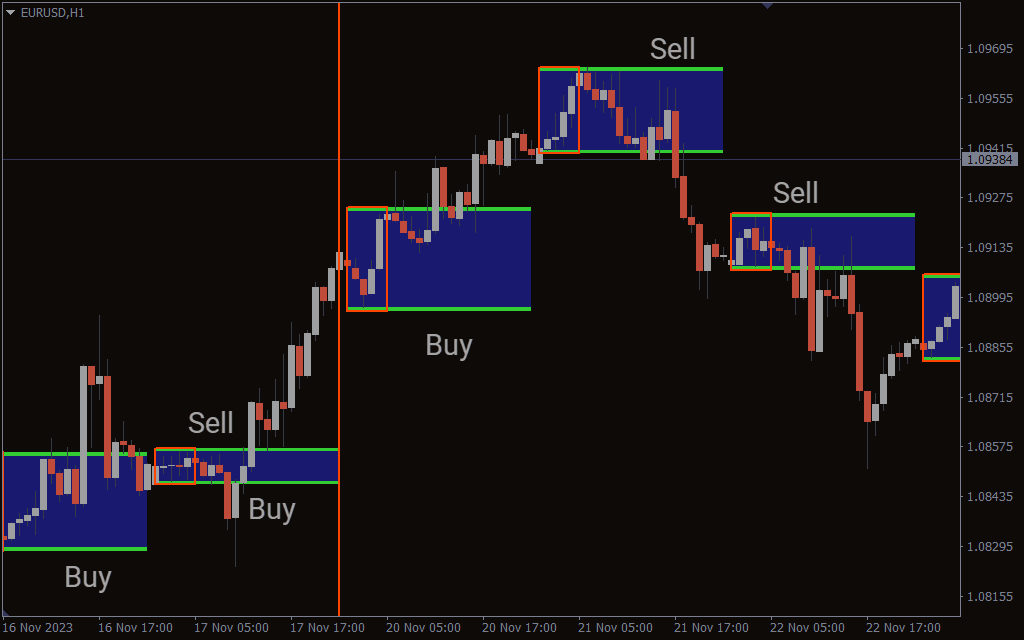
The indicator plots box period till 0.00 to 5.30 as red, while the whole box from 0.00 to 23.00 is green, with the high and low prices marked with blue. According to the indicator the high and low prices during the Asian trading session between 0.00 and 5.30 forms the base for the rest of the trading day. As a result, in this strategy the high acts as resistance and the low acts as support.
The trading strategy is to enter the markets if the price breaks the high or low of the box. If the price breaks and closes above the high or resistance, traders should enter buy trade and place a stop below the low or support. Traders should book profits with a good RR. A similar trading strategy can be followed if the price breaks and closes below the support line or low.
Pros and Cons of the Buy-Sell Volume Indicator
 Pros
Pros
- Very simple visual tool with clear levels for trading.
- Works well for intraday strategies, especially in volatile pairs.
- Easy to install and beginner-friendly.
- Can be combined with other tools for more advanced setups.
 Cons
Cons
- Best suited for short-term trading — not effective for long-term trends.
- False breakouts can occur without confirmation filters.
- Results vary depending on the instrument and session volatility.
Conclusion
In summary, the Breakout panca eagle indicator for MT4 is based on a time based breakout trading strategy. For those interested in exploring more powerful strategies, I recommend also checking our blog post on 10 Best TradingView Indicators, which provides broader insights into how breakout concepts tie into modern trading systems.
Frequently Asked Questions (FAQ)
 Does the Breakout Panca Eagle Indicator work on all pairs?
Yes, it can be applied to any forex pair, though it performs best on volatile pairs like GBP/JPY or GBP/USD.
 Which timeframe is most effective?
The indicator is designed for intraday trading, so M15, M30, and H1 work best.
 Does it repaint past boxes?
No, once the breakout box is formed, it remains fixed for the day.
 Can I use it for scalping?
Yes, scalpers can use it, but it’s recommended to confirm with volume or candlestick patterns.
 Is it beginner-friendly?
Absolutely. The visual simplicity makes it easy to understand and apply, even for new traders.

1 2 3 4 5