
XTSR Indicator
MT4The XTSR Indicator for MT4 will help you find supports and resistances in a chart. We’ll teach you how to use it here.
Description
Support and resistance levels are important concepts in trading. As such, it can easily be found by a trained eye. But to some degree, there’s a bias towards what you can and can’t see. As always, human thinking places some degree of subjectivity, especially when looking at charts with their eyes only.
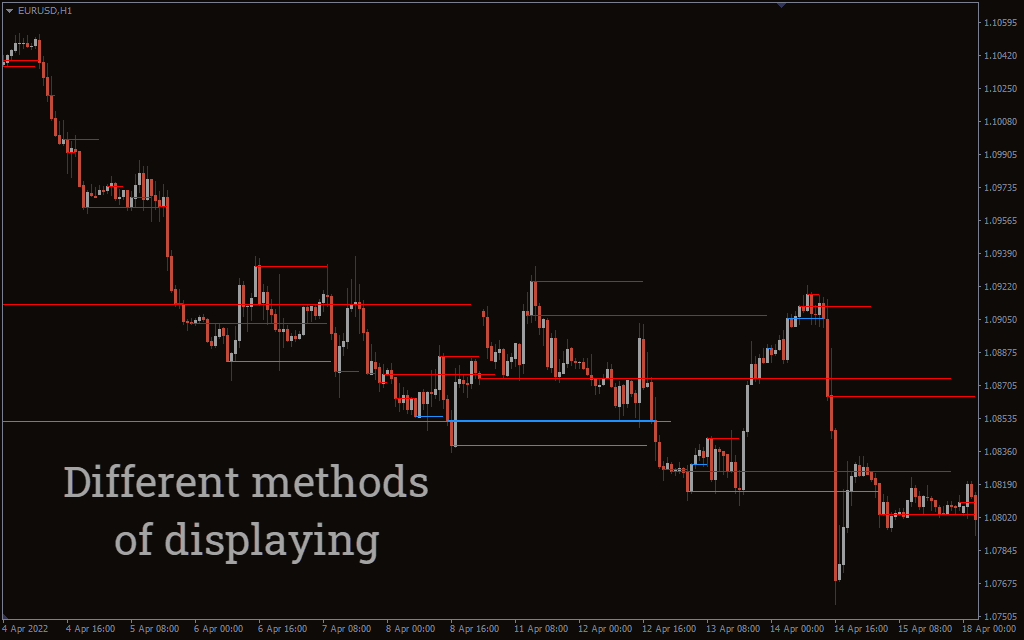
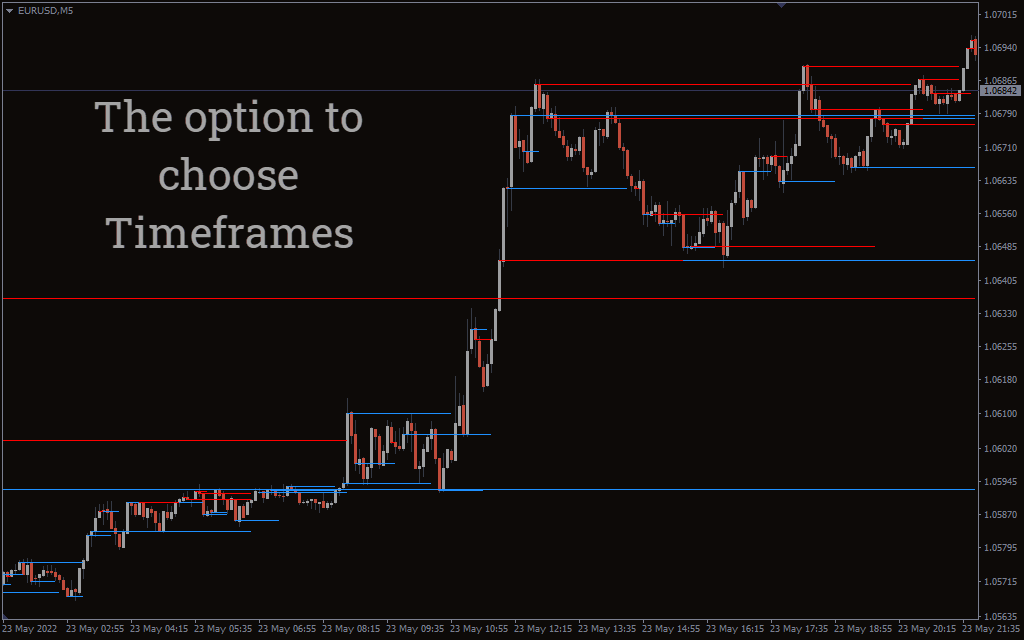
Thus, you can use the XTSR indicator for MT4 to help you check out support and resistance levels within a chart. In this way, there’s an objective way to find these important price levels within an instrument. The red lines indicate important resistance levels, while the blue lines indicate vital support levels.
How To Trade The XTSR Indicator For MT4
It will be difficult to trade the XTRS without the help of another technical indicator. As such, you can use any other indicator that you like and combine it with the support and resistance levels shown on the chart. For instance, you can use it with the FX Forecaster to time your entries based on the positioning of the histogram. Our examples below combine the XTRS with the Fibonacci retracement tool to look for pullbacks.
XTSR Bullish Or Buy Signal
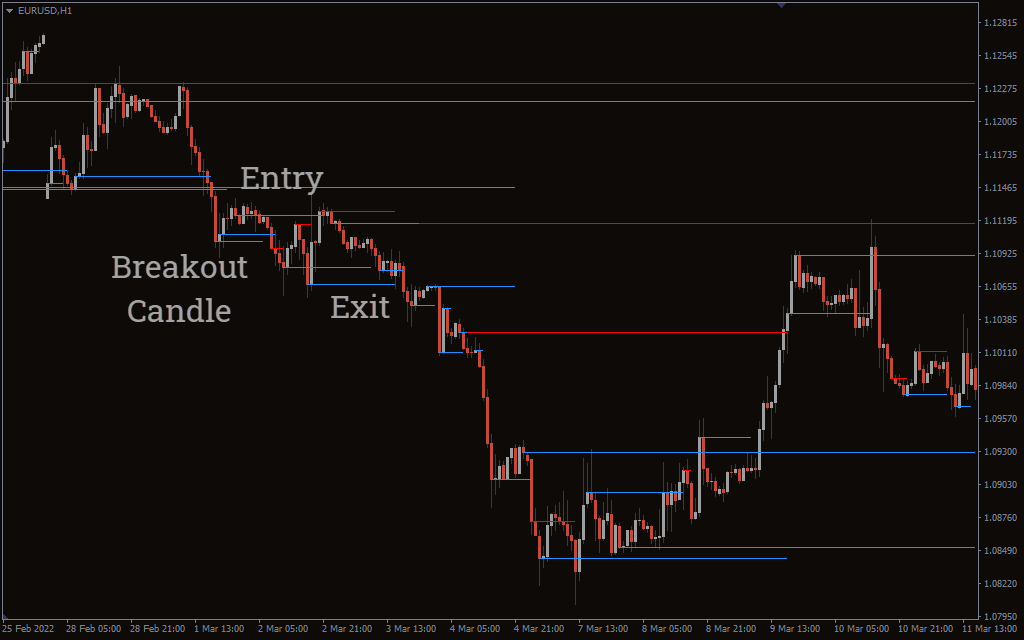
A buy signal is generated within the XTSR indicator if an important resistance level is broken by the candlestick towards the upside. You may enter after the close of that breakout candlestick. Or, you may include a fibonacci retracement to wait for a pullback near the 38.2 or 50.0 level.
You enter at the first bullish candle bar near the 38.2 or 50.0 level. You will hold the position until the next resistance is hit or formed. To check out how this is done, view the charts we have created below:

XTSR Bearish Or Sell Signal
A sell signal is generated with the XTRS indicator if an important support level is breached downwards. You may enter after the downward breakout candle closes. Or, you may place fibonacci retracement to wait for a pullback near the 38.2 or 50.0 level.
If you’re going to wait for a pullback, you will enter at the first bearish candle (red candle) near the 38.2 or 50.0 fibonacci retracement level. You will hold the position until the next support is hit or formed. Check out the chart below:
Conclusion
Since important price levels are usually where the candlesticks bounce off of, the XTSR indicator for MT4 can help you determine these support and resistance lines. Looking at the charts with the naked eye can put a certain degree of subjectivity to your analysis. The XTSR indicator can give you an objective way of viewing the support and resistance levels within the chart.
However, it’s difficult to use supports and resistances alone to determine how to trade a particular instrument. Thus, we recommend that you use the XTSR indicator for MT4 in conjunction with other technical indicators or fundamental analyses.
1 2 3 4 5