
Tipu RSI Indicator
MT4Forex BUY and SELL signals from the best Tipu RSI Indicator. Find out overbought and oversold levels.
Description
The Tipu RSI Indicator is a simple MT4 indicator that tells about the overbought and oversold levels. The indicator follows the principles of the traditional RSI but adds a bit of customization. Firstly, it highlights the signal line with blue or red color. Secondly, it plots arrows to give exact entry and exit points.
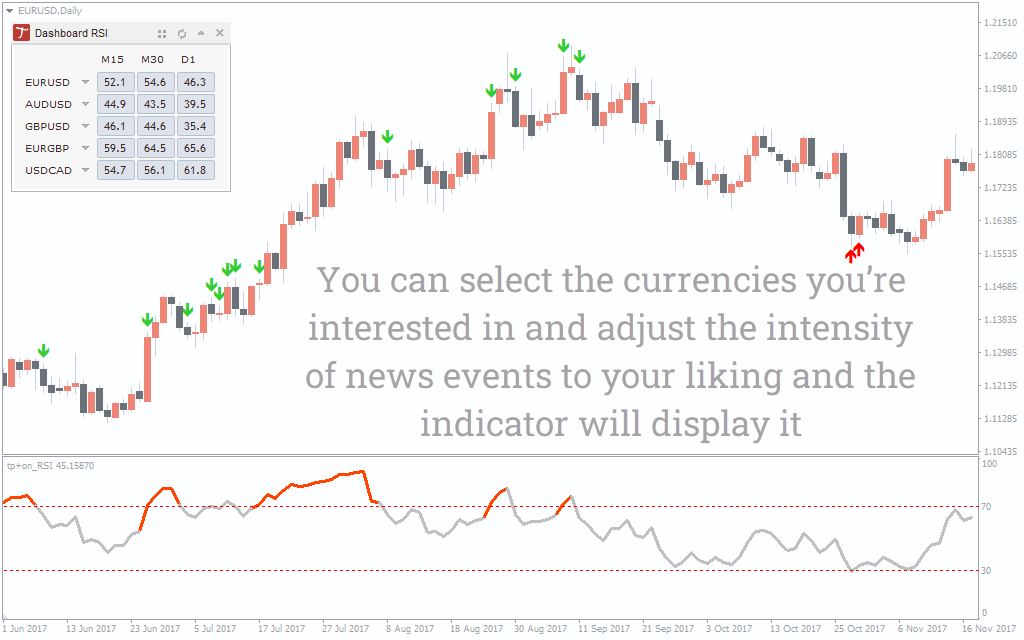
Lastly, the Indicator plots a timeframe dashboard on the chart. It is a customizable dashboard, and traders can change the symbol and the timeframe settings. The Tipu RSI Indicator works best on all timeframes, and traders can switch the timeframe easily through the indicator’s dashboard.
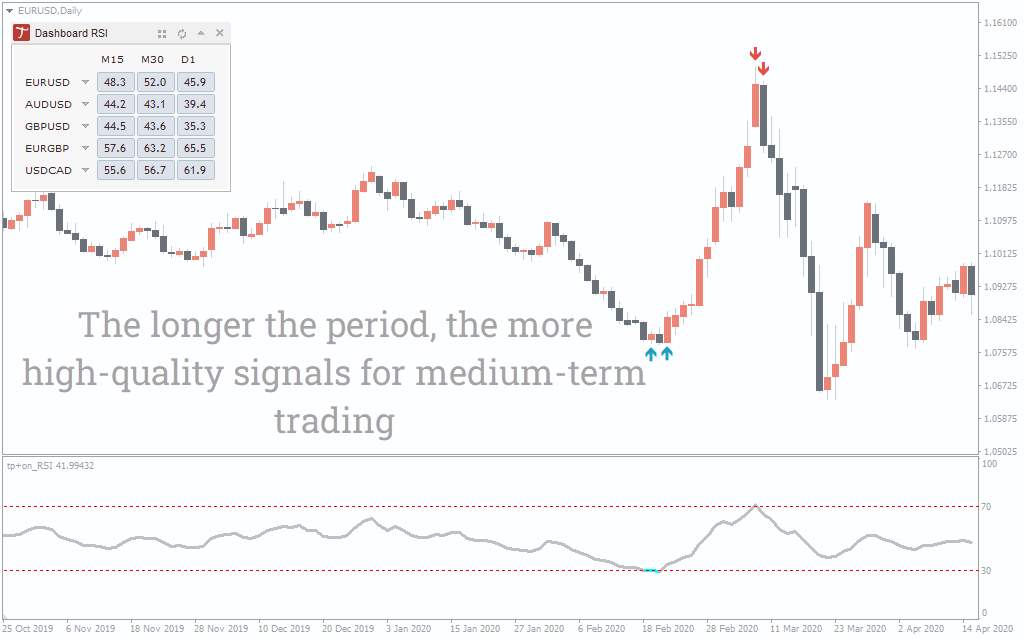
Tipu RSI Indicator BUY/SELL signals
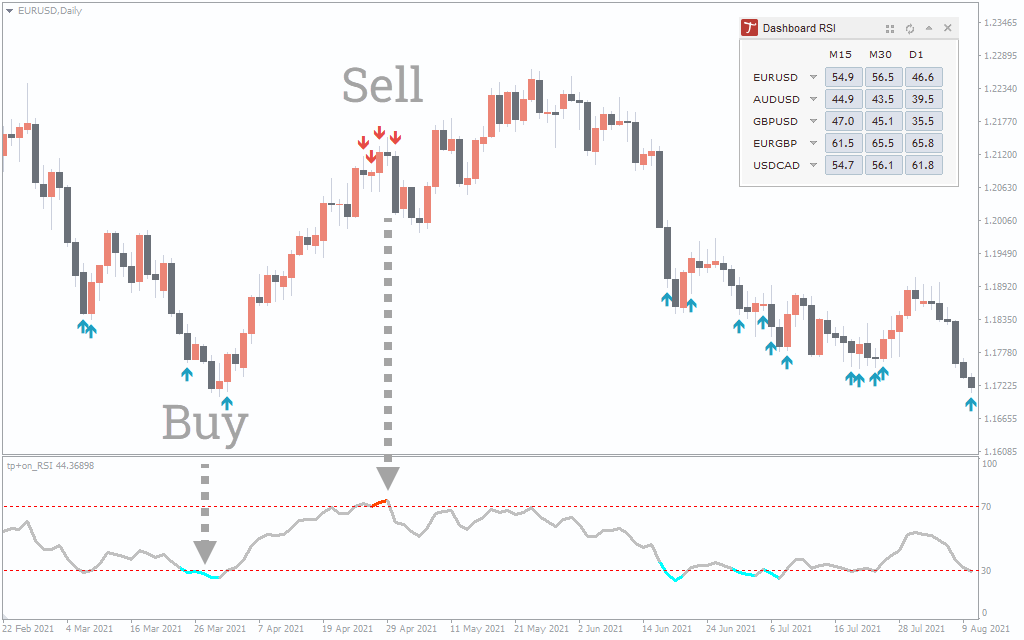
The above EUR/USD Daily chart shows the BUY and SELL signals for the indicator. To determine BUY and SELL signals, traders need to look at the arrows and the signal line. If the indicator plots blue arrows and the signal line is highlighted in blue, it’s an oversold level and a BUY signal.
Conversely, if the indicator draws red arrows and the signal line is highlighted in red, it’s an overbought level and a SELL signal.
Conclusion
The Tipu RSI Indicator adds customization to the traditional RSI and tells the exact entry and exit points. Traders can also change the timeframe through the Tipu dashboard. Also, you can download the indicator for free on our website.

1 2 3 4 5