
SFT Fractal Support and Resistance Indicator
MT4SFT Fractal Support and Resistance is ideal support and resistance detectors.
Description
The whole idea of reading is buying low and selling high. This means that you need a tool that can identify the highs and the low of the market. This is where the SFT Fractal Support and Resistance indicator come in handy.
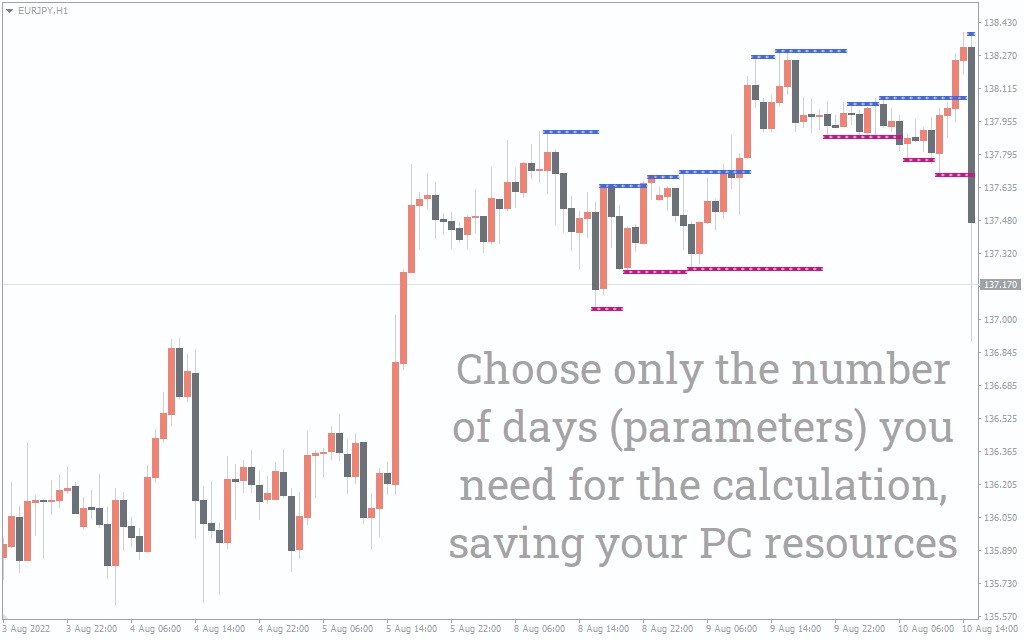
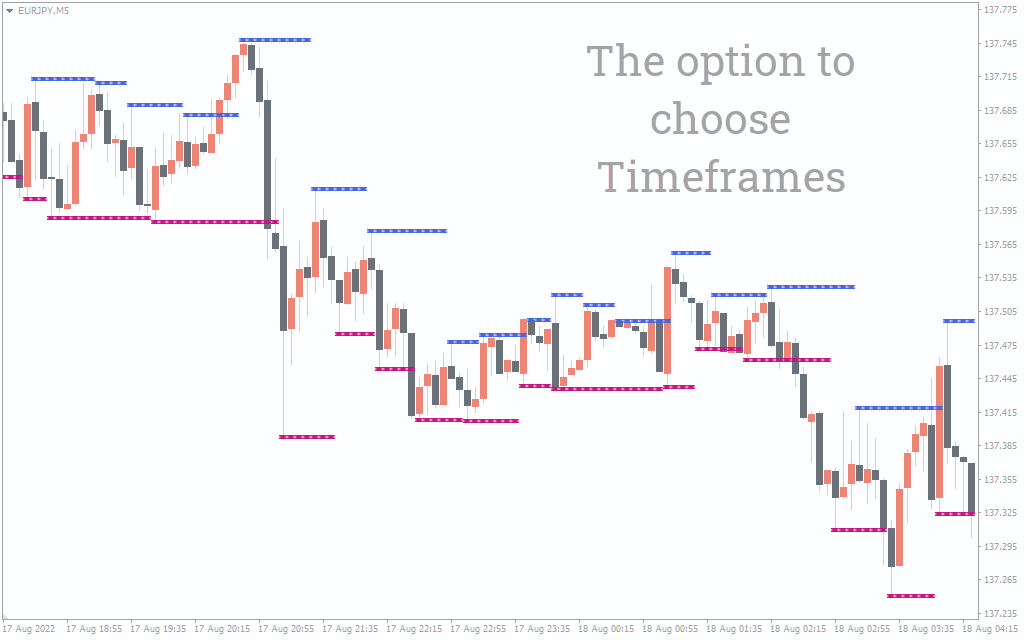
The non-redrawing indicator shows the highest and lowest price value (fractals). The upper boundary is the resistance, while the lower boundary is the support. You should prepare for a reversal when the price hits the highest price. The indicator can be used by both seasoned and rookie traders. It provides clear trading signals you can use for manual trading and developing expert advisors.
How to Trade Using the STF Fractal Support and Resistance
Using the indicator is quite straightforward. You should get ready to sell when the price action hits the resistance level. Consider opening long positions when the indicator hits the support level.
SFT Fractal Support and Resistance Trading Example
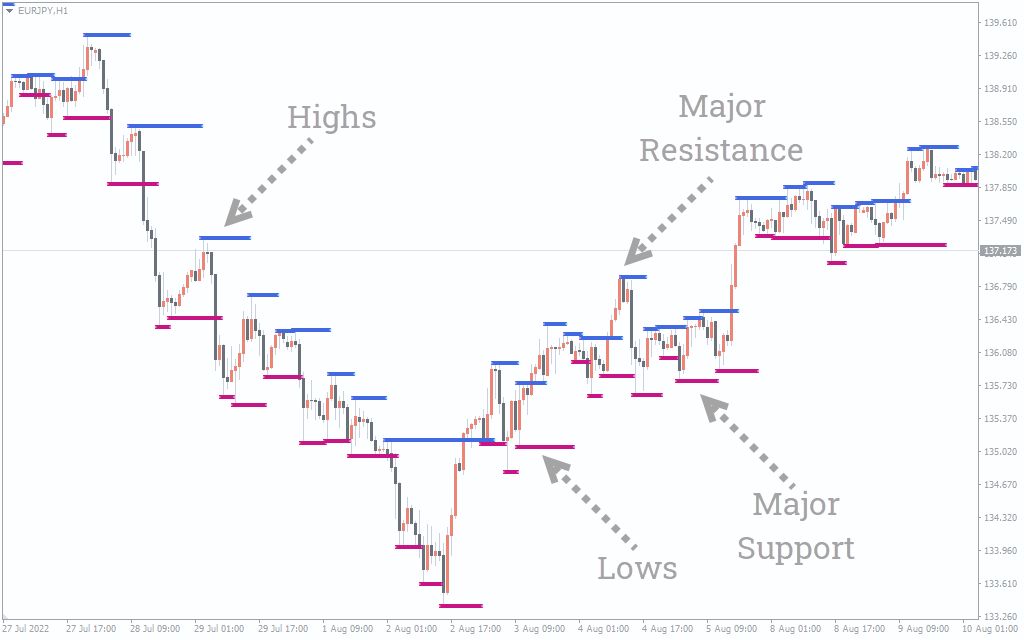
The indicator shows the price movement of the US dollar against the Japanese yen. Essentially, the indicator posts lows and highs. The price tends to reverse on certain major levels. Specifically, the downtrend reverses after hitting a major support level (lows). On the other hand, the uptrend reverses after hitting resistance levels. Therefore, you should wait for a reversal signal immediately after the indicator posts the levels.
Conclusion
STF fractal is a suitable trading tool that draws low and high in the market. The idea is to give you support and resistance levels where the price will likely reverse so you can get ready to enter the market as the new reversal starts.

1 2 3 4 5