
Rate Of Change Indicator
MT4Find out how much currency pairs are changing with the Rate Of Change indicator for MT4.
Description
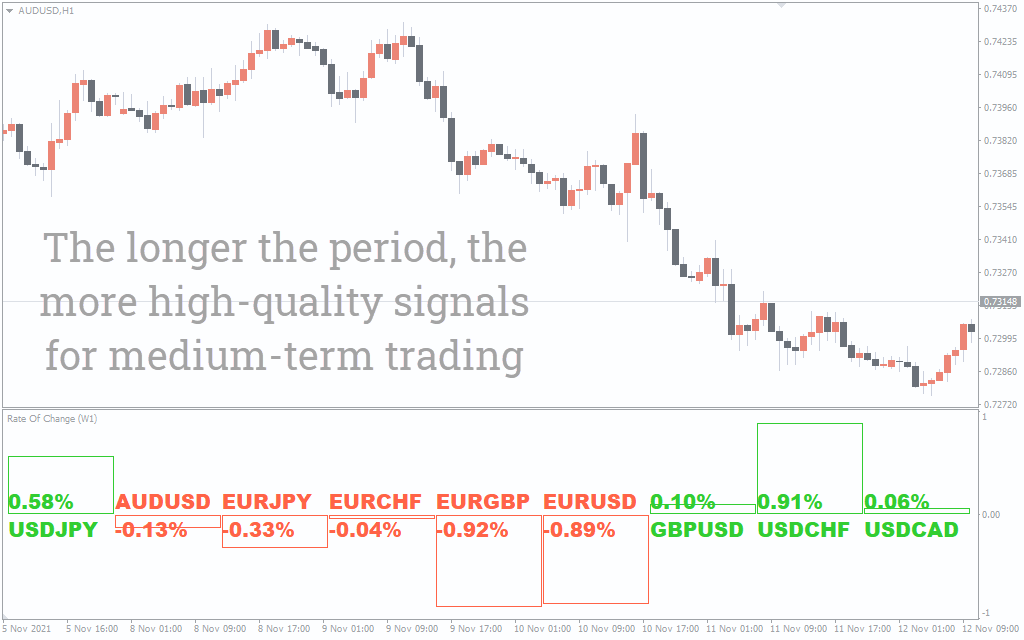
The Rate Of Change (ROC) indicator for MT4 gives you a change in the rate of currency pairs during the specific period. The ROC stands for rate of change, and that’s what the indicator paints.
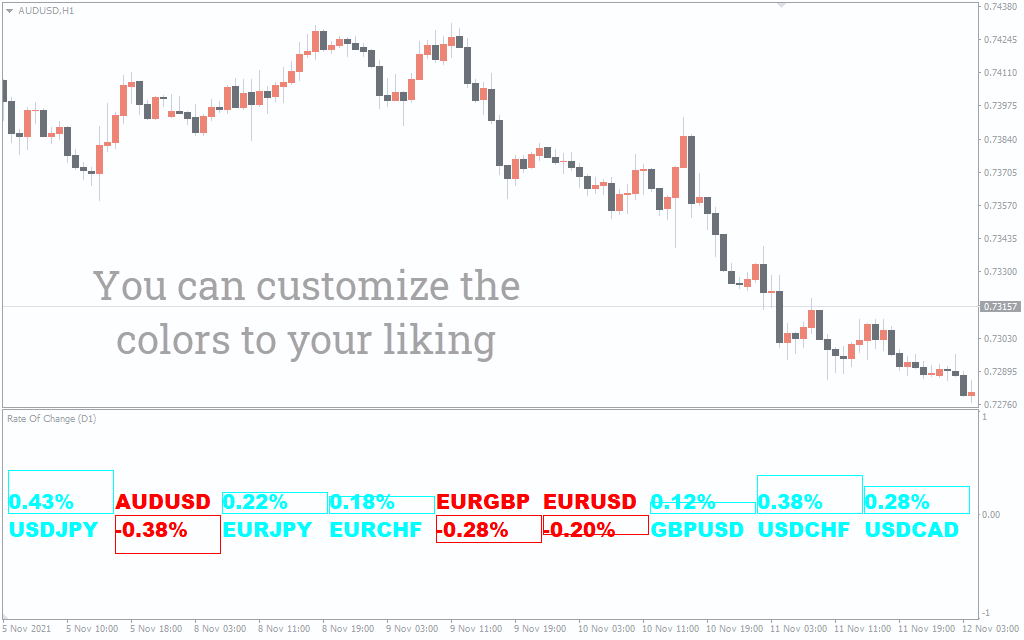
It presents you with fluctuations of different currency pairs, plotting them in red and green. When the indicator illustrates a red color that means the currency pair is trending downwards. On the flip side, when the ROC paints green color, it indicates the pair’s uptrend.
The ROC applies to nine currency pairs involving majors and minors. These include USD/JPY, AUD/USD, EUR/JPY, EUR/CHF, EURGBP, EURUSD, GBP/USD, USD/CHF, and USD/CAD.
These pairs show up at the bottom and paints in red and green depending on the rate of change.
As the indicator doesn’t present you with buy and sell signals, you can apply it on any timeframe. The good thing with ROC is that you always know the market sentiment to take positions accordingly.
How to trade with the ROC indicator?
The ROC indicator is not a typical buy or sell indicator. Instead, it illustrates the rate of change of each currency pair in a specific period.
The red and green color lets you decide where the market is heading for a default period of 1 day. After looking at the pair’s rate of change, you can take your positions accordingly.
If the pair is in green, this means bulls are dominating against bears, and you can take long positions or exit your short ones.
Conversely, if the pair is red, this suggests that bears are winning the battle, and you can enter short or exit your long positions. When intra-day trading, you can locate the rate of change of a pair on a longer timeframe like a day or weekly and then apply it on a shorter timeframe.
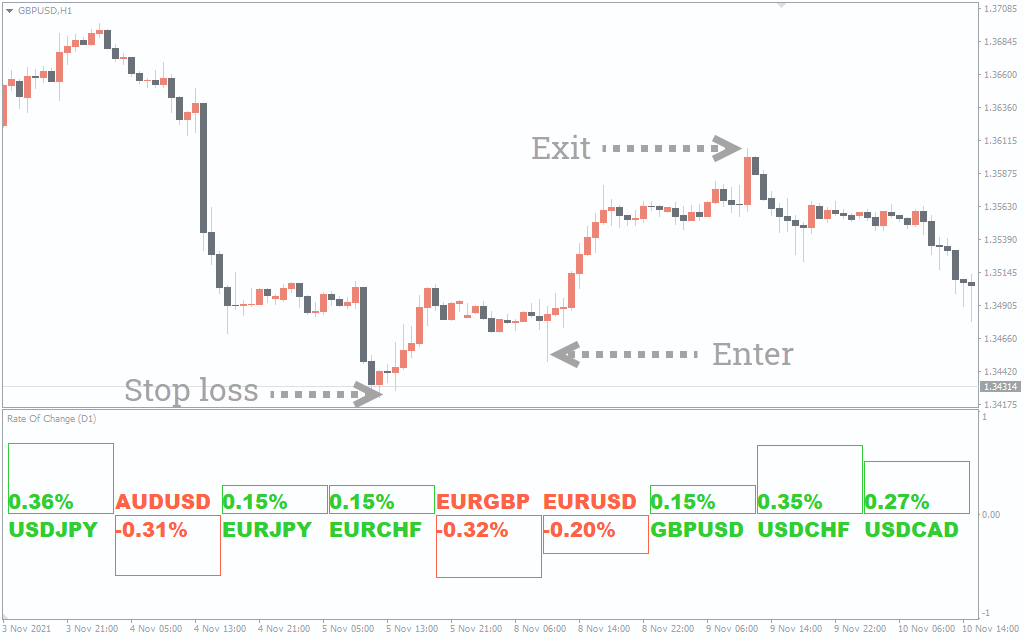
ROC indicator buy setup
- Select the pair in green.
- Wait for the trend to fully develop.
- Enter the trade at an uptrend.
- Put a stop-loss near the low of buying point.
- Exit the trade when the trend changes.
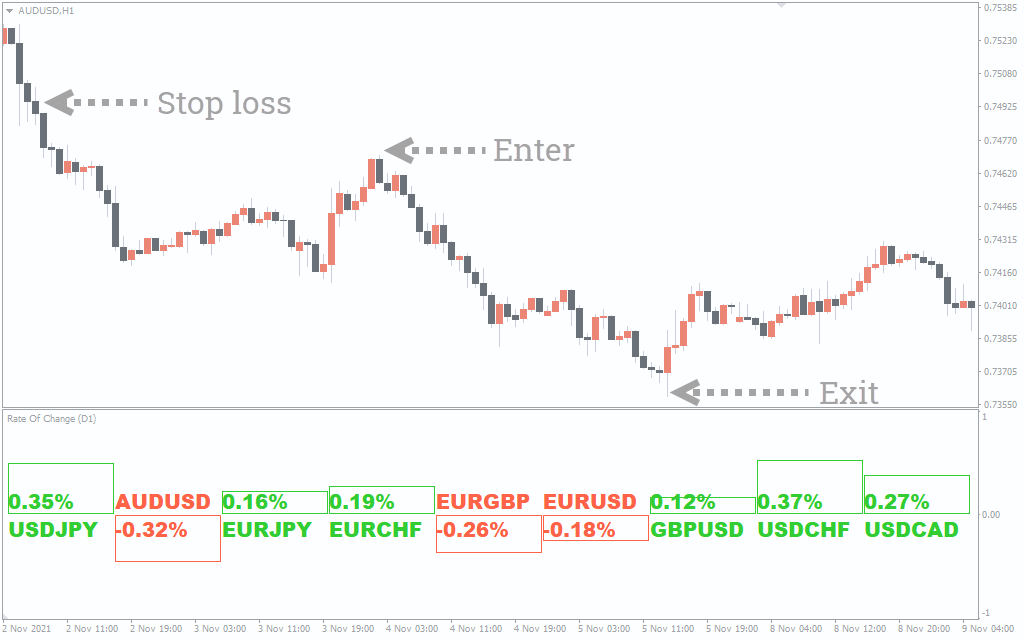
ROC indicator sell setup
- Select the pair in red.
- Wait for the trend to fully develop.
- Enter the trade at a downtrend.
- Put a stop-loss near the high of buying point.
- Exit the trade when the trend changes.
Conclusion
The ROC indicator is great for finding the currency pair’s rate of fluctuations. However, the indicator doesn’t give you exact entry and exit points. So, it’s better to use it with other technical indicators.

1 2 3 4 5