
Mass Index Indicator
MT5Also Available for MT4The Mass Index for MT5 indicator, developed by Donald Dorsey, helps traders identify trend reversals by examining the difference between the highs and lows of a currency pair over a period.
Description
It is said in the Forex market that trends are traders’ friends and therefore it is advisable not to go against the trend. However, trend reversals do happen and early detection of a trend reversal is an effective way to make a highly profitable Forex trade. The mass index indicator is one of the few technical indicators that effectively identify and warn of a trend reversal.
Base
The Mass Index Indicator for MT5 helps traders identify trend reversals by examining the volatility and momentum of a currency pair.
A trend change, called a reversal swell, is defined when the indicator rises above 27 levels and then falls below 26.5.
Once this indicator signals the swell of a trend, traders can enter short or long trades or positions.
The chart below shows the Mass Index indicator on the GBP/USD H1 chart.
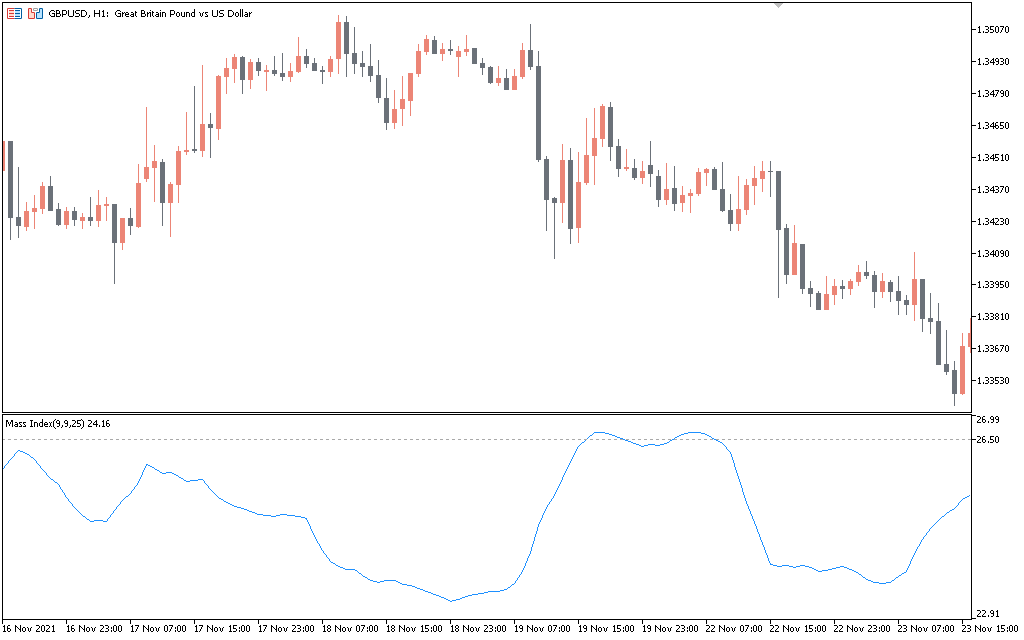
On the chart above, 2 important levels (26.5 and 27) of this indicator are highlighted with purple lines for easy identification.
How to use the mass index
When a reversal bulge occurs on the Mass Index indicator, traders should look for a trend reversal.
A long or short trade can be entered when there is a reversal pattern such as a bullish engulfing, bearish engulfing, pin bar or doji candle.
The GBP/USD H1 chart below shows how a short trade was entered using the mass index indicator.
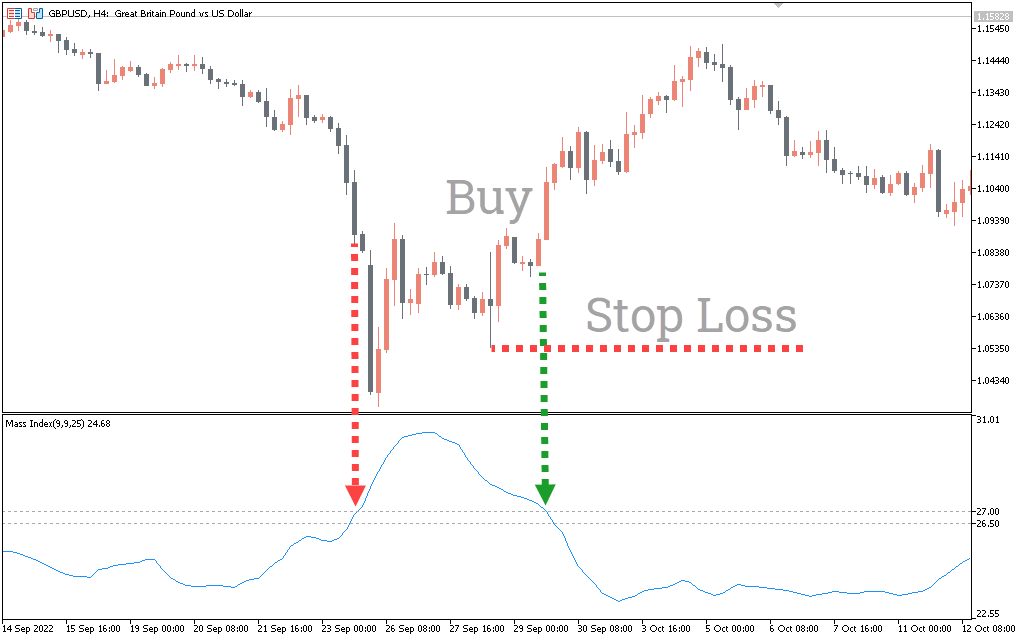
In the GBP/USD H1 chart above, there was a bearish move from Septmber 23 to 29, 2022 with the Mass Index above 27 levels (indicated by the red vertical line).
On September 29, 2022, the mass index fell below 26.5 (indicated by the green vertical line), forming a reversal bulge.
A BUY trade (denoted by an up arrow on the main chart) was made when a bullish engulfing candle (denoted by a blue circle) formed on the chart as confirmation that the downtrend had ended and the uptrend had begun.
A stop loss can be placed around the swing low or slightly below the lowes candle of the day (indicated by the red horizontal line on the main chart).
A trailing stop is best used when trading in a trending market to track the pips and see if a new trend is forming.
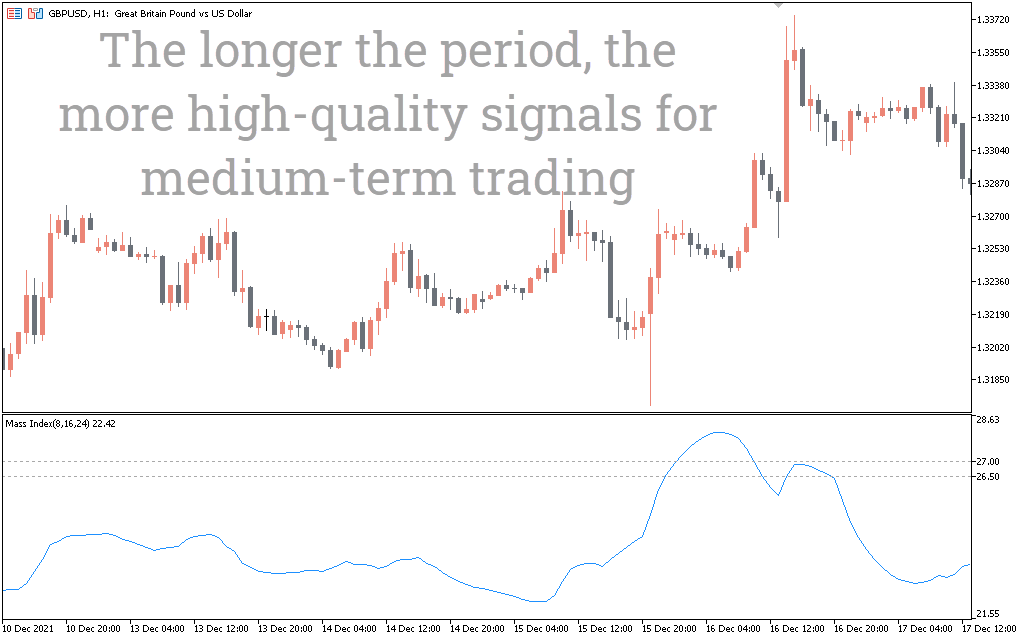
This indicator can be used on any timeframe, but is best used on higher timeframes (daily, weekly and monthly charts).
Conclusion
The mass index indicator is one of the best indicators for recognizing a trend reversal. This indicator can be used on any time frame and is very easy to understand.
Finally, the Mass Index indicator can be used on its own, but gives the best results when used in conjunction with price action and other technical indicators such as moving average crossovers and the MACD.
1 2 3 4 5