
Market Structure Volume Distribution Indicator
MT5The Market Structure Volume Distribution Indicator MT5 by LuxAlgo combines volume profiles with market structure to reveal key trading zones.
Description
The Market Structure Volume Distribution Indicator for MT5 by LuxAlgo is a sophisticated analytical tool that merges market structure visualization with detailed buy and sell volume distribution. It helps traders understand not only where price reacts but also how much volume is traded at specific structural levels.
Unlike standard volume profile tools that focus on static volume zones, this LuxAlgo indicator dynamically aligns volume activity with pivots, highs, lows, and structural turning points, allowing traders to spot accumulation, distribution, and breakout readiness zones in real time.
From my experience, this indicator brings clarity to price behavior by showing how market participants engage around support and resistance levels. It’s an ideal tool for intraday and swing traders who rely on order flow and structural confluence.
Market Structure Volume Distribution Trading Signals

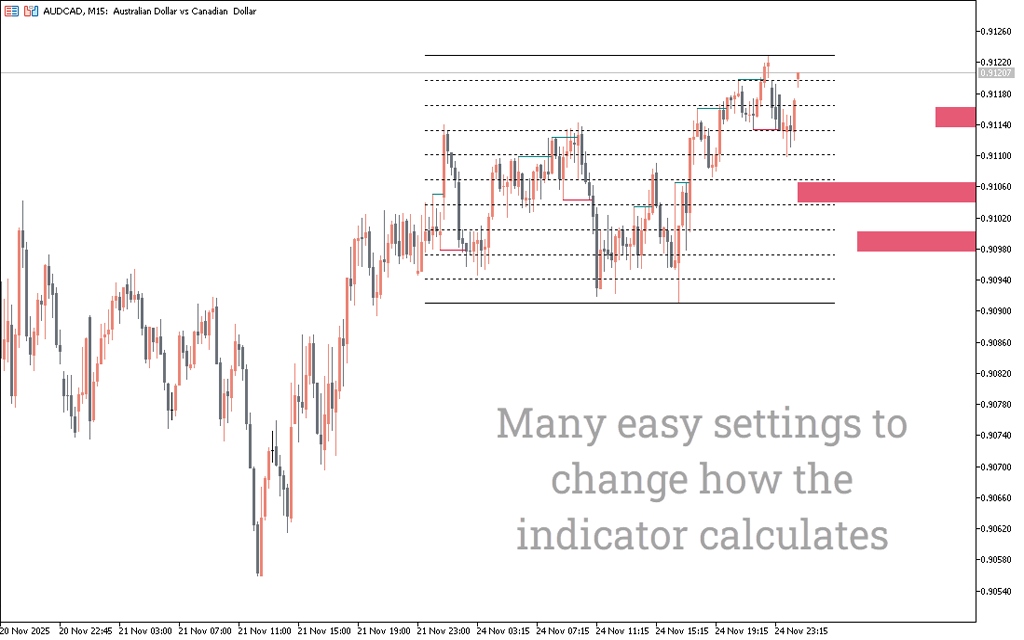
The indicator works by scanning recent bars and mapping buy/sell volume distribution around key pivot-based structures. These pivot zones are automatically identified and marked with colored segments — teal for buying volume and crimson for selling pressure.
When teal-colored zones dominate near a structural low, it often indicates bullish accumulation — a sign that buyers are absorbing supply. Conversely, when crimson areas expand near resistance or swing highs, it can signal distribution and potential bearish reversal.
Traders can use this data to confirm breakout strength, identify exhaustion zones, or detect imbalances between supply and demand. I’ve found it especially useful for timing entries after liquidity sweeps or retests of recently formed structural levels.
Another powerful element is the grid level visualization, which uses dotted lines to show equilibrium and structural alignment. These help in identifying confluence between price action and historical volume nodes — something I use frequently when managing stop placement or profit targets.
Conclusion
The Market Structure Volume Distribution Indicator for MT5 by LuxAlgo gives traders a unique edge by combining volume analysis with clear market structure visualization. It reveals where the heaviest buying or selling occurs, helping identify institutional footprints and reaction levels long before price confirms them.
In my experience, this indicator turns raw volume data into actionable insights — showing exactly where liquidity forms, who controls the move, and when momentum might shift. For traders who value precision and structure, this is one of the most advanced tools LuxAlgo has released.

1 2 3 4 5