
Detrended Synthetic Price Indicator
MT4Also Available for MT5Master market conditions with Detrended Synthetic Price Indicator for MT4. Identify overbought, oversold, and trend reversal signals with this histogram-style tool.
Description
John Ehlers was the person who first created the detrended synthetic price oscillator. There are some ways you can use this indicator. It mainly shows overbought and oversold market conditions. This version of the Detrended Indicator represents its data as a histogram at the bottom of your chart.
How To Use The Detrended Synthetic Price Indicator For MT4
The indicator is in the form of a histogram. You have many vertical lines on the bottom of your screen that change colors to red or green depending on your selected settings. The first choice is when you select the option that prompts the vertical lines to change color when the price crosses the zero line. In this case, green vertical lines would indicate that the price has crossed the zero line from below. This indicates a buy signal.
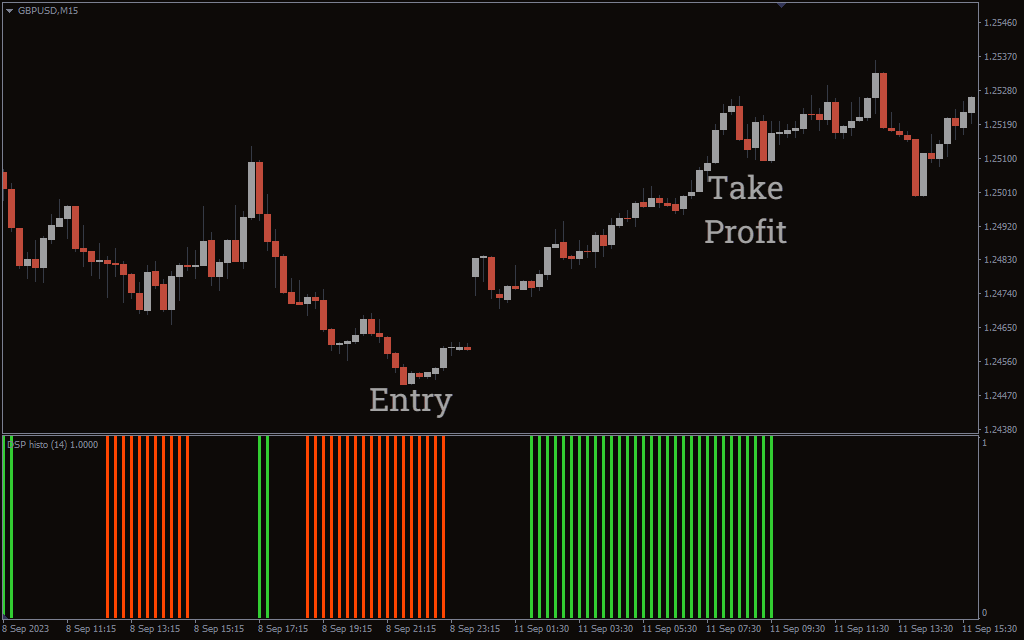
If the vertical lines turn red, the price has crossed the zero from above. This signals a downward trend, meaning you can enter a short position.
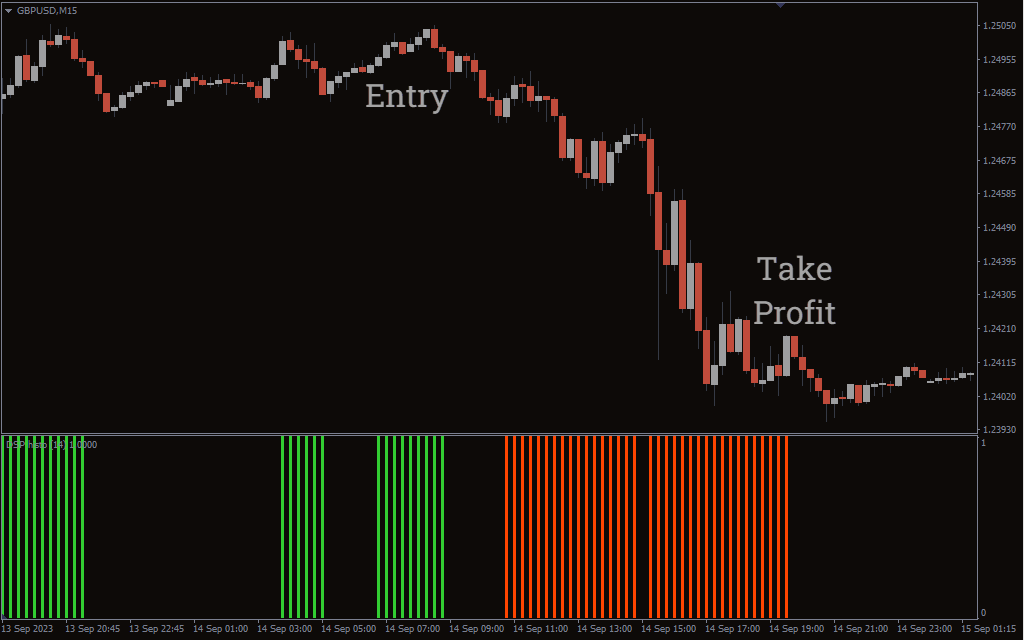
Another way you can use the indicator is by capturing trend reversals. On the settings, you can activate the ‘change color on slope change’ option, which will change the color of the vertical line when a reversal occurs. A change from red to green would indicate a reversal from a downtrend to an uptrend. When the color changes from green to red, the trend will likely shift from uptrend to downtrend.
It is important to note that this indicator lags. This means most of the time, it gives signals after the fact. You should, therefore, incorporate some technical analysis and other indicators to increase your trade entry accuracy.
Conclusion
The Detrended Synthetic Price indicator shows you overbought and oversold market conditions in the form of a histogram. You can also use the indicator to capture reversals.

1 2 3 4 5