
Point and Figure Indicator
MT5Point and Figure Indicator MT5 filters market noise and highlights true trends using X/O columns for precise breakout signals.
Description
The Point and Figure Indicator (P&F) for MetaTrader 5 is a classic yet highly effective tool aimed at filtering out market noise and uncovering only meaningful price movements. Unlike standard candlestick charts which reveal every tick and change of price, Point and Figure (P&F) charts screen out insignificant price changes and provide only substantial movement.
This method helps traders focus on what is important – trend direction, breakouts, and key levels. The price action-based indicator instead of time-based means that, in volatile or choppy markets, this model is highly relevant.
One main reason for the strength of the P&F method is simplicity. When it strips away time, the chart is much clearer and patterns easier to discern. The result tends to be more confident decision-making, particularly whenever one is trading breakouts or trend continuations.
From my experience, noise-reducing tools generally greatly increase the quality of trade. The Point and Figure Indicator does just that by making you focus on structure, not distractions.
Point and Figure Indicator MT5 Trading Signals
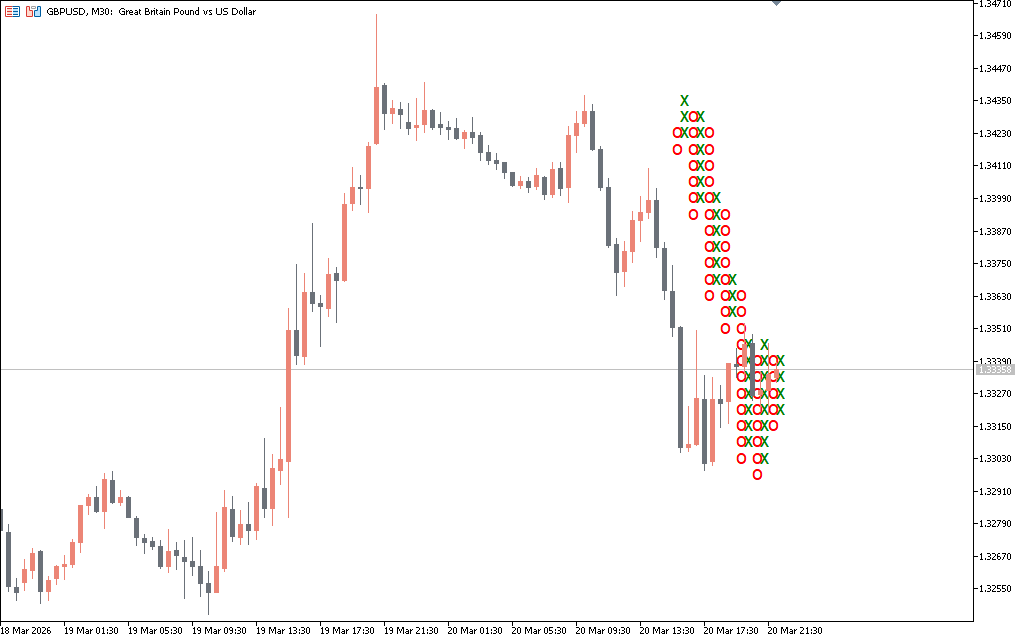
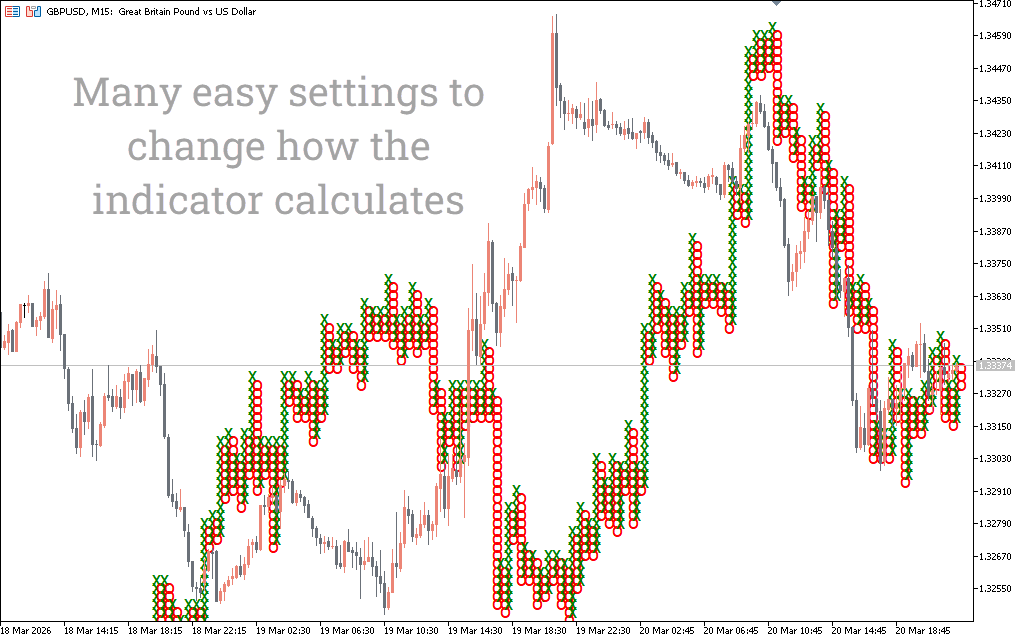
The Point and Figure Indicator uses columns of X and O symbols to represent price movement. X columns show rising prices and bullish momentum, and O columns show falling prices and bearish pressure.
When the market switches on this axis, the critical signal is from an O column to an X column. This transition suggests that buyers have regained control and that the market may be shifting into an upward move. The chart that moves from X into O indicates increasing selling pressure; in the reverse way, it shows rising prices being faced by sellers.
One of the strongest signals for P&F analysts is the breakout. When a new column of X exceeds the previous column’s high, it indicates a bullish breakout or probable continuation. Likewise, when a column of O breaks below a previous low, it indicates a continued bearish trajectory.
Since the indicator is designed to filter out minor fluctuations, these breakout signals tend to be more reliable than those of a traditional chart. More importantly, however, you are trading something that was confirmed rather than reacting to every little candle.
Another key is the idea of reversal. The indicator only changes direction after a predefined number of boxes to prevent false signals. This automatic filtering is one of the reasons that P&F charts are beloved by experienced traders.
When I sit back, I tend to rely more on P&F signals to confirm the trading process. A breakout pattern that is consistent with a key support or resistance level of the standard chart is an indication of a highly successful trade possibility.
Conclusion
The Point and Figure Indicator MT5 is a classic way to see price action without noise. Its format and structure give traders a very different perspective to zero in on real movement in the market, and is great for trend spotting and breakout opportunities.
The emphasis on the movement of price, rather than time, gives an alternative way of looking at the data which complements traditional chart analysis.
It serves to weed out weak signals and shows only meaningful shifts in market direction. The Point and Figure method remains one of the most reliable decision tools that traders can use.

1 2 3 4 5