
XARDG RSIOMA Indicator
XARDG RSIOMA Indicator For MT4 combines RSI and OMA MetaTrader indicators to provide the best forex trading bullish and bearish trend trading signals.
Description
The XARDG RSIOMA indicator for MT4 is a combination of the classic RSI and OMA indicators. RSI – Relative Strength Index provides the measure of trend strength and overbought and oversold market conditions.
OMA – Oscillator of Moving Averages provides the trend direction and potential trend reversal signals. So the combination of these provides stable and profitable forex trading signals using multiple trading methods.
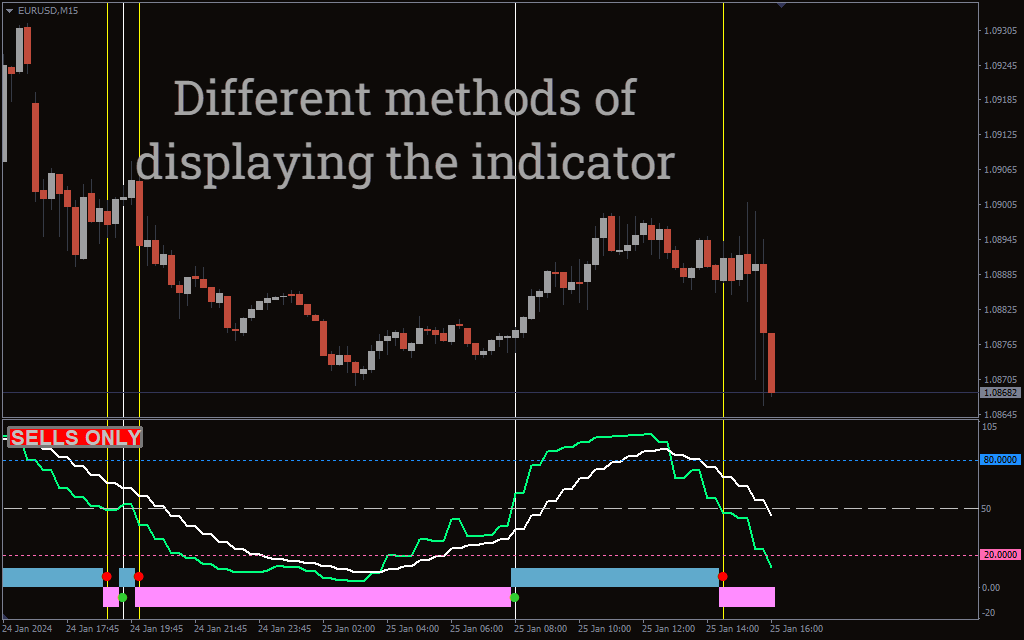
This indicator does not repaint after the candle close and helps forex traders to trade with confidence. Furthermore, the trading signals are easy to interpret for new and advanced forex traders. Moreover, it works on all intraday chart time frames as well as the daily, weekly and monthly price charts.
XARDG RSIOMA Indicator For MT4 Trading Signals
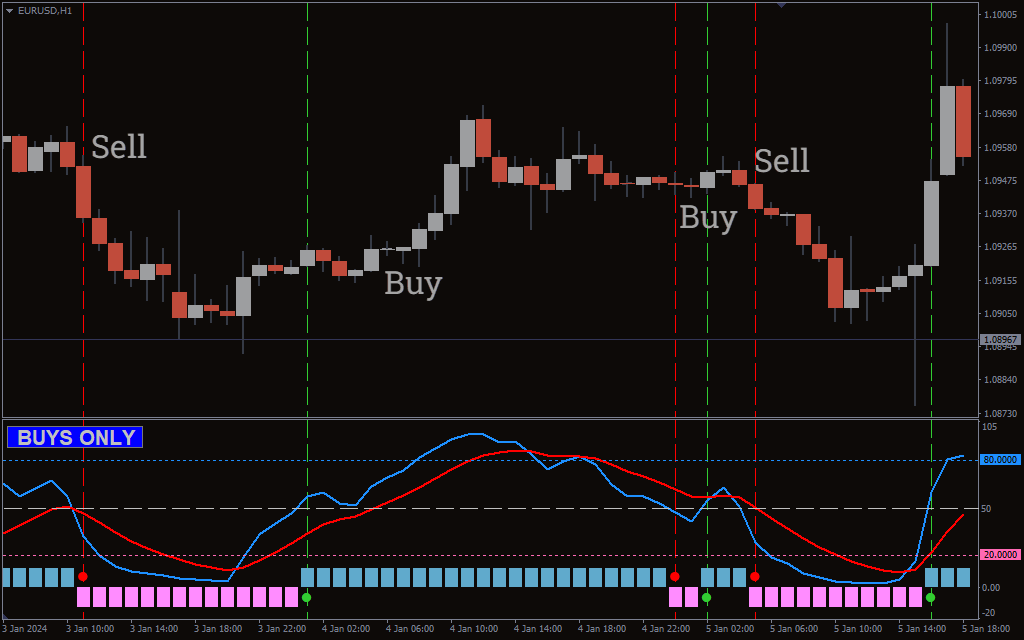
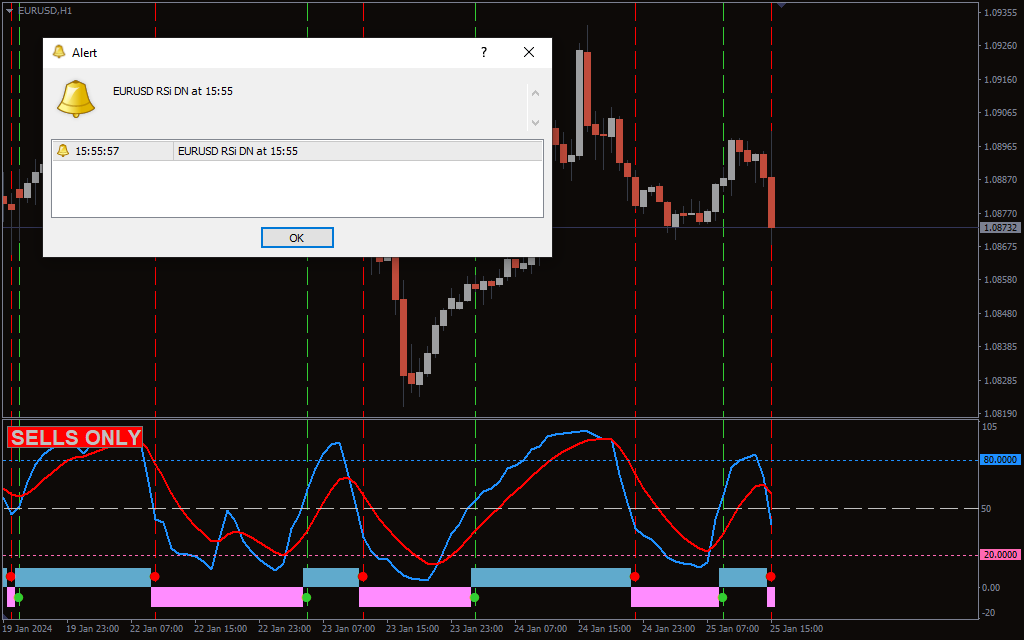
The indicator plots red RSI line and Blue RSIOMA line. Additionally, it plots a 0 level, 50 levels and 100 levels in the indicator window. The green lines on the price chart shows potential buy signals, while the red line indicates sell signals. Forex traders can derive multiple trading strategies and input signals using this indicator.
The first trading strategy is to look for the crossover of the Red and Blue indicator lines, in other words the RSI and RSIOMA line. If the blue line crosses the red line upwards it indicates a bullish trading signal. So, traders can enter the markets with a buy trade with a stop loss below the previous swing low. As a trend following strategy traders should book profits at an opposite trading signal.
Similarly, if the blue line crosses the red line downwards, it indicates a bearish trend signal. Traders should consider entering the markets with a sell position. A stop loss should be placed above the previous swing high and book profits at the opposite signal.
The next trading strategy is to wait for further confirmation of the entry point. In addition to the above trading signal of the previous trading strategy, traders should wait for both the red and blue lines to move higher than 50 levels for buy signal.
Generally, RSI above the 50 level is considered as a strong bullish trading signal. So, the RSI and RSIOMA value both above the 50 act as additional confirmation. Similarly, traders can wait for both the red and blue lines to move below the 50 level before entering a sell trade.
Traders may note that the entry point may be delayed by a few pips in the second trading strategy. However, the second trading strategy provides much stable trading signal.
Conclusion
In summary, the XARDG RSIOMA indicator for MT4 provides entry and exit trading signals. It is very helpful for forex traders using the classic RSI MetaTrader indicator. In fact, there are other trading systems that combine moving averages with the RSI. However, a combination of RSI with the Oscillator of moving average of RSI in this indicator is an interesting approach.

1 2 3 4 5