
Mass Index Indicator
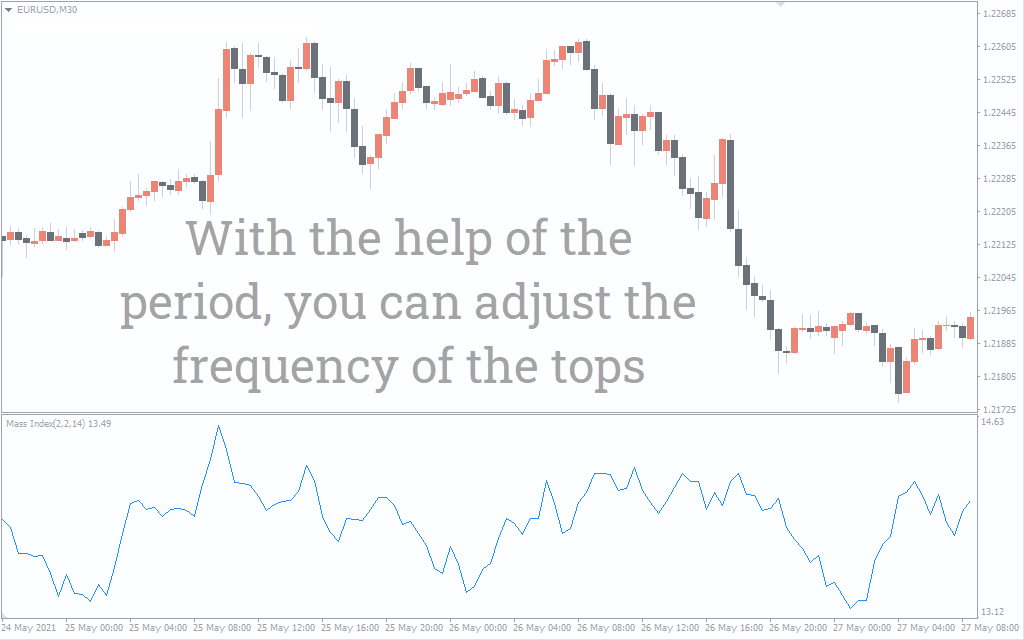
The Mass Index indicator for MT4, developed by Donald Dorsey, helps traders spot trend reversals by examining the high and low differences of a currency pair over a period.
Description
In the Forex market, there is saying that trends are traders’ friends, and as such, it is advisable not to go against the trend. Nonetheless, trend reversals do occur, and identifying a reversal trend early is an effective way to make a highly profitable trade in Forex. The Mass Index Indicator is one of the few technical indicators that effectively identifies and gives a trend reversal alert.
Foundation
The Mass Index Indicator for MT4 helps traders spot trend reversals by examining the volatility and momentum of a currency pair.
A trend change, called a reversal bulge, is identified when the indicator moves above the 27 levels, then drops below 26.5.
Once a trend bulge is signaled by this indicator, traders can open short or long trades or positions.
The diagram below shows the Mass Index Indicator on the USD/JPY H4 chart.
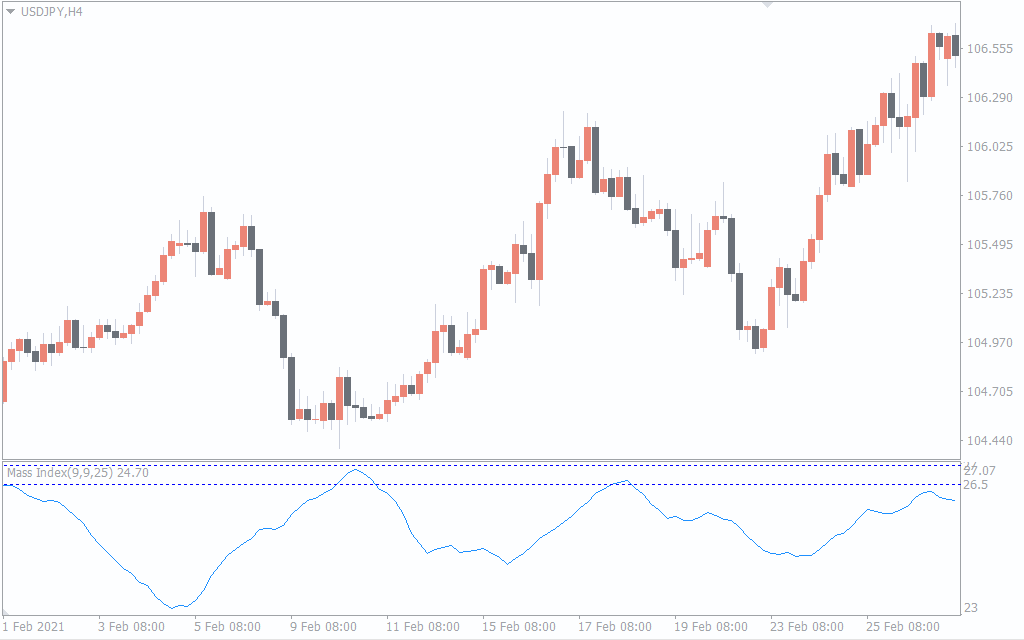
In the chart above, 2 important levels (26.5 and 27) on this indicator are marked out with purple lines for easy identification.
How to use the Mass Index Indicator
When a reversal bulge occurs on the Mass Index Indicator, traders should watch out for a trend reversal.
A long or short trade can be taken when a reversal pattern such as bullish engulfing, bearish engulfing, pin bar or a doji candlestick is seen.
The USD/JPY H4 chart below gives an illustration on how a short trade was taken using the Mass Index Indicator.
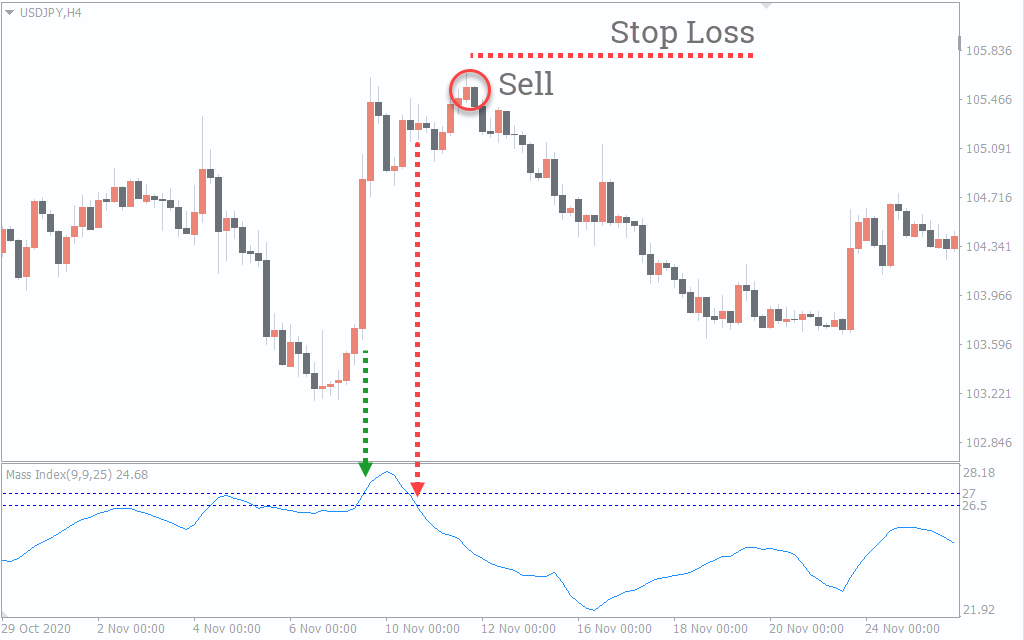
In the USD/JPY H4 chart above, there was a bullish movement from 6th November till 9th November 2020, with the Mass Index above 27 levels (indicated with a blue vertical line).
On November 10, 2020, the Mass Index dropped below 26.5 (indicated by the red vertical line), forming a reversal bulge.
A sell trade (indicated by the down arrow on the main chart) was taken when a bearish engulfing candle (indicated by the blue circle) was formed on the chart as a confirmation that an uptrend ended and a downtrend began.
A stop loss can be placed around the swing high or a little bit above the highest candle of the day (around 105.73, indicated by the green horizontal line on the main chart).
A trailing stop is best used for a trending market trade to trail the pips, and ride the new trend forming.
This indicator can be used on any time frame, but it’s best used on higher time frames (daily, weekly and monthly chart).
Conclusion
The Mass Index indicator is one of the best indicators for recognizing a trend reversal. This indicator can be used on any time frames and is very simple to understand.
Finally, the Mass Index indicator can be used solely, but gives the best result when used together with price action and other technical indicators such as Moving Average crossover and MACD.

1 2 3 4 5