
KAMA Indicator
KAMA indicator for MT5 provides forex trading signals using Kaufman’s Adaptive MA and identifies flat and trending markets.
Description
The KAMA indicator for MT5 is a dynamic moving average indicator, the nature of which changes depending on market trends. KAMA is an abbreviation for Kaufman Adaptive Moving Average developed by Perry Kaufman. As a rule, moving averages are lagging indicators. But the indicator hugs prices and plots too close to price if the market is moving slowly.
On the other hand, KAMA distances itself from the price of a trending market. Thus, leaving a sufficient gap between the price and the indicator line during volatile price movements. In this way, forex traders can understand the trending and range nature of the market and buy and sell accordingly.
The indicator is suitable for beginners and experienced forex traders. Beginner forex traders can easily identify the trending and flat nature of the market and prepare trading strategies accordingly. However, advanced forex traders can apply several trading strategies using this indicator.
The indicator works well on intraday price charts as well as daily, weekly and monthly price charts. Thus, forex traders can use the indicator to determine the market trend on a higher timeframe and use it for top-down technical analysis. In addition, the indicator is free to download and easy to install.
KAMA Indicator For MT5 Trading Signals

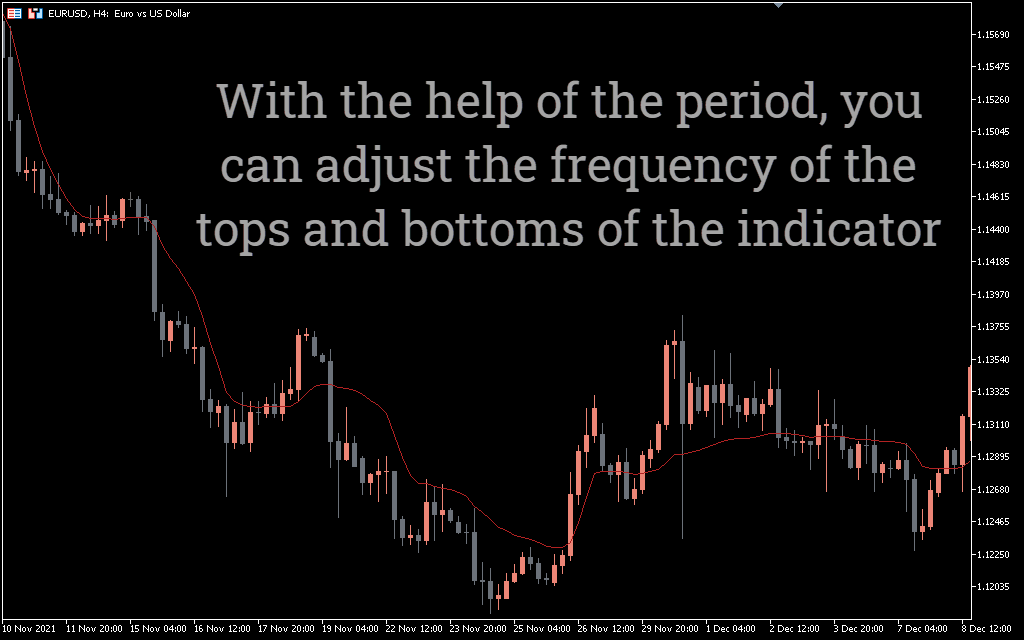
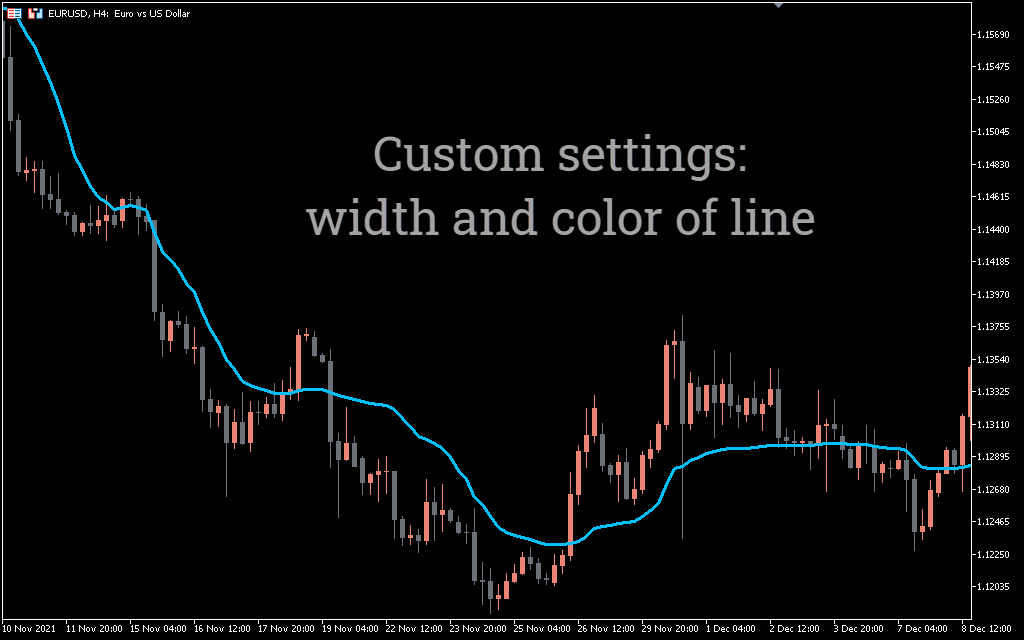
The above EURUSD H4 candlestick chart shows the KAMA indicator for MT5 in action. The indicator shows the KAMA line on the chart in RED. Forex traders can apply the indicator line and price crossing trading strategy. In addition, traders can use the crossover of several indicators using slow and fast KAMA. However, the latter option is not preferable, as it gives pending trading signals.
If the price is flat or in a narrow range, the KAMA indicator line remains flat. Thus, forex traders should stay away from the markets and refrain from trading during this period. If the price crosses the line of the KAMA indicator and closes up, this indicates a potential bull market. Therefore, forex traders should enter the market with a buy position with a stop loss below the previous swing low. Moreover, the indicator does not provide a profit target, so traders should look for an exit with a good risk/reward ratio.
Similarly, if the price closes below the KAMA indicator line, it indicates a potential bearish price trend. A sell trade is guaranteed by a stop loss above the previous swing high. The direction of the KAMA indicator shows the potential direction of the market trend. An upward KAMA line signals bullish market conditions, while a downward KAMA line signals bearish market conditions. Forex traders can use this to spot the main trend and place trades in that direction and ignore trading signals in the opposite direction.
Conclusion
The KAMA indicator for MT5 or the Kaufman adaptive moving average is one way to make moving averages more sensitive and adaptive to market volatility. While the indicator is easy to use, it tends to give false trading signals as it aggressively overrides the price. Thus, forex traders must use additional tools such as price action to confirm trading signals.
1 2 3 4 5