
Japanese Candlestick Patterns Indicator
Trade the best price-action setups using the Japanese candlestick patterns on MTF charts of MT4. Spot highly potential buy-sell signals in forex & stock trading.
Description
The Japanese Candlestick Patterns represents an automatic candlestick pattern detecting indicator for MT4. It helps beginners become familiar with price structures and understand how they work in financial trading markets.
Apart from showing the high-low and open-close prices, a candlestick structure also reflects the market sentiment. Traders utilize candlestick charts to predict potential price movement based on historical trends.
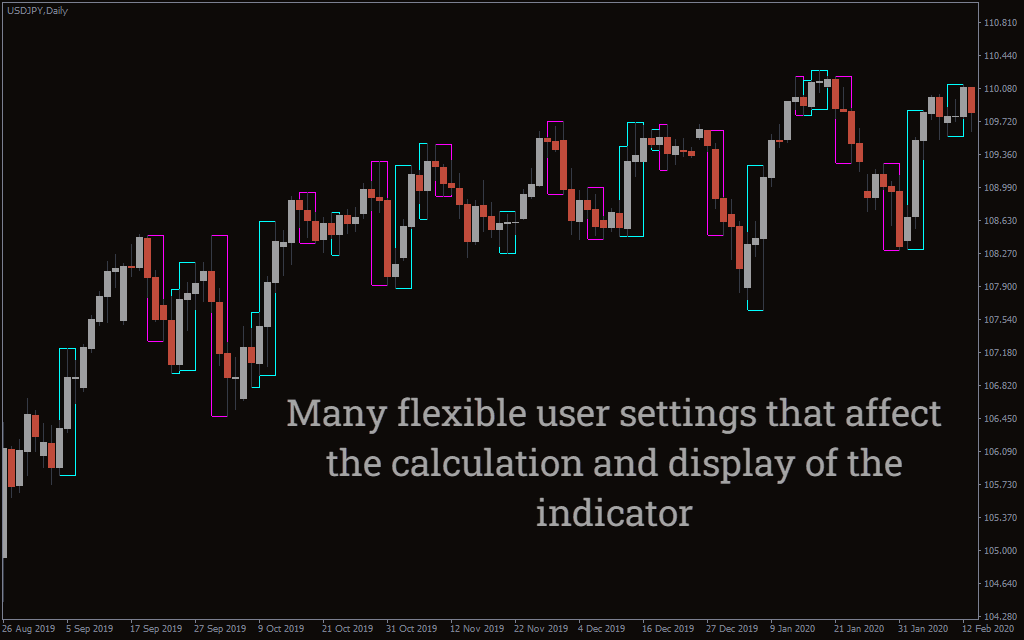
When you’re using the Indicator, you don’t need to memorize all the names and formations of the patterns. The indicator automatically scans after every candle closes and shows detailed info about the potential candlestick pattern.
This interactive trading guide explains the best way to trade forex and stocks using the Japanese Candlestick Patterns Indicator for MT4.
How to use the Japanese Candlestick Patterns Indicator in MT4
Japanese candlestick means displaying price movement over a predetermined time frame. By showing the price movement precisely, they offer helpful information, such as market sentiment or potential market reversals.
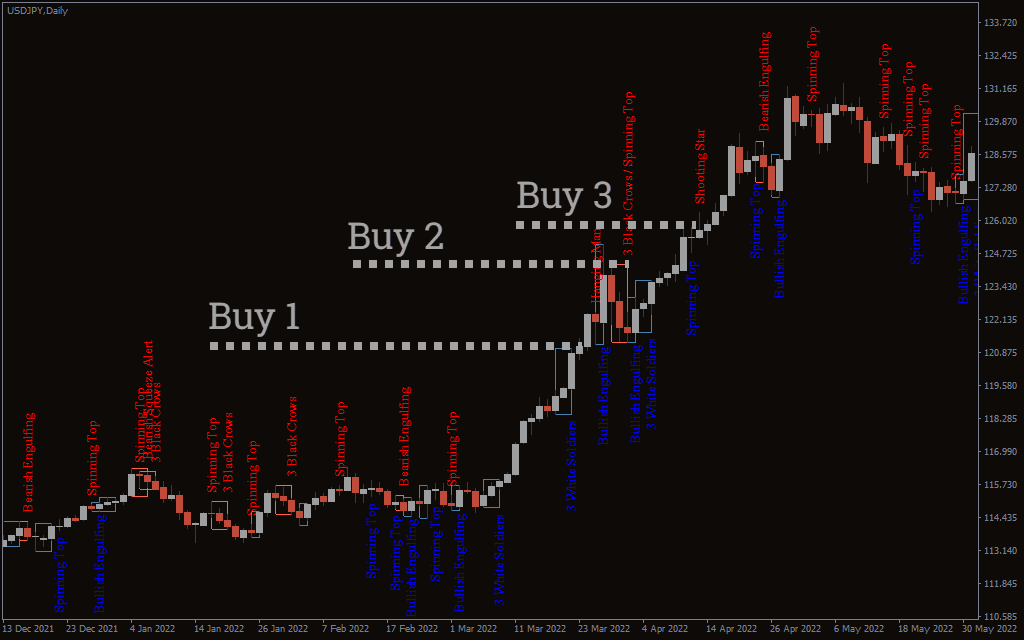
The Japanese Candlestick Patterns will show you all the chart patterns it detects within the past 200 bars. However, it doesn’t filter trend-following signals. So, you may need to add a trend indicator to place the trades within the current market momentum.
In the above daily USD/JPY chart, we’ve added a 10-day simple moving average to assess the market bias. So, once the price exceeds the 10-SMA, we can decide only to pick buy signals in line with the bullish trend. As you can see, each time we activated buy orders based on the bullish candlestick patterns above the moving average made a successful upside run.
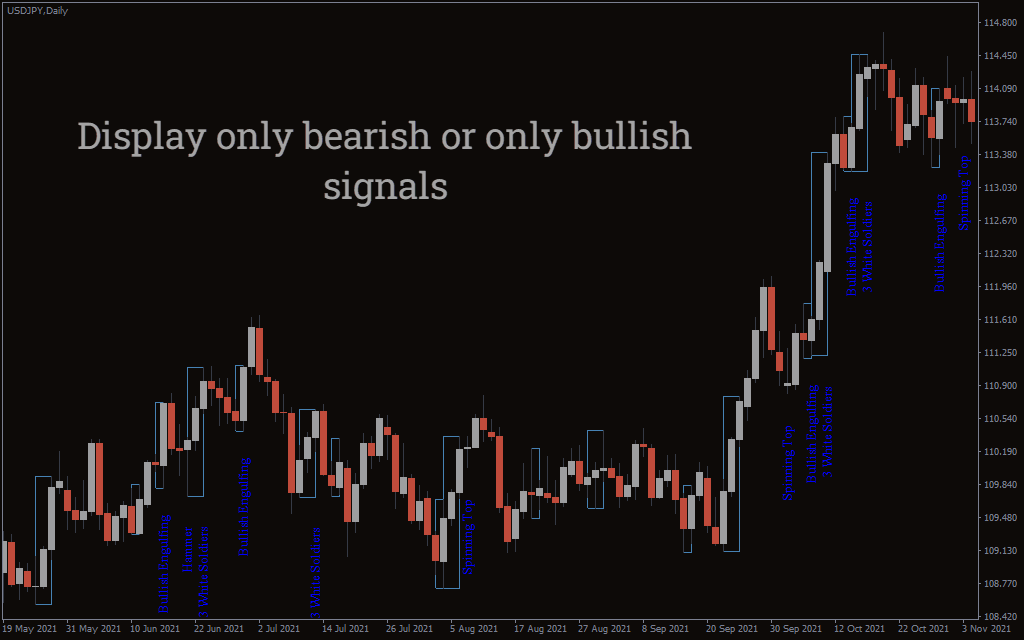
Although, there is no concrete rule for not going against the trend. With the Japanese Candlestick Patterns, you can also anticipate counter-trade signals. For instance, the chart prints a bearish engulfing pattern and fails to exceed a significant resistance level. It means the price has lost its bullish momentum, and it’s time to activate sell orders.
Conclusion
Trading has started to employ candlestick charts more frequently than any other technical analysis tool in the past few decades. Candlestick charts are more detailed than bar and line charts at a glance and have a brief, easy-to-analyze appearance. Apply the Japanese Candlestick Patterns Indicator in your MT4 platform and start exploring the thrill of price-action trading.