
Color Metro Stochastic Indicator
Description
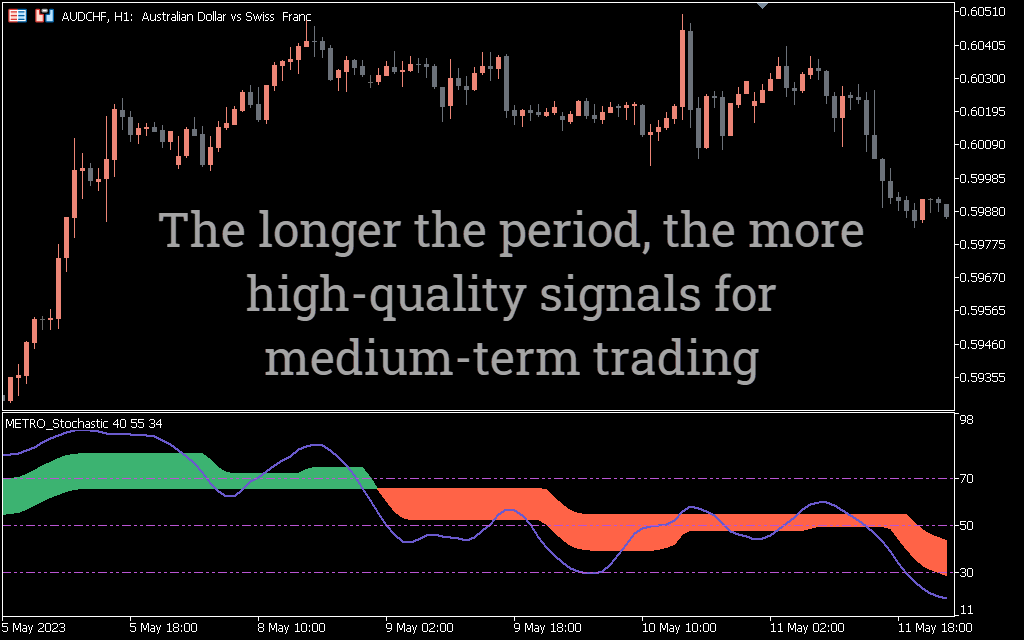
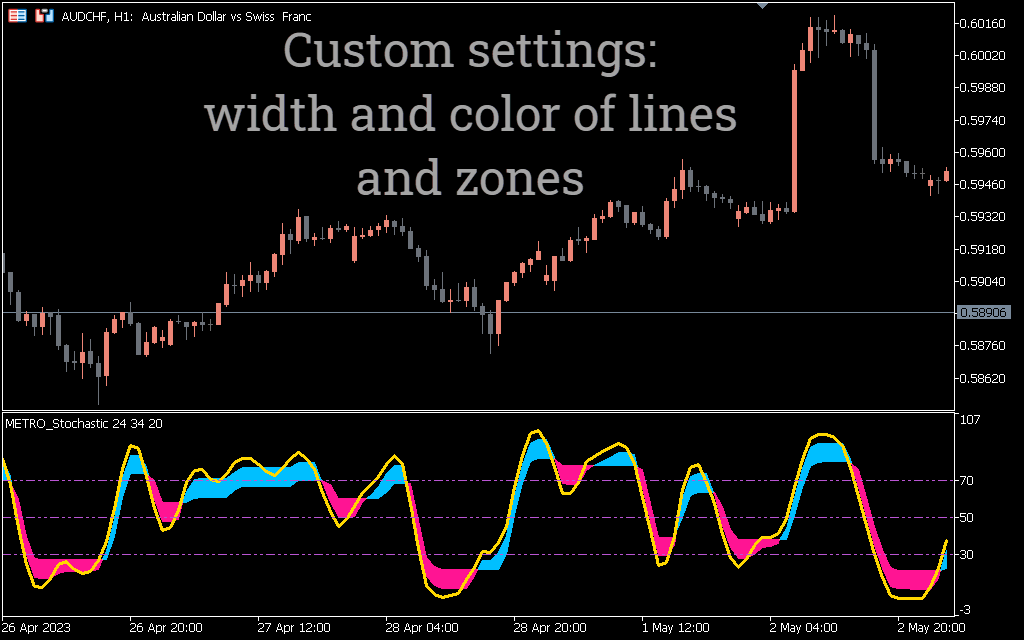
The Color Metro Stochastic indicator for MetaTrader 5 highlights extreme price zones (overbought/oversold) with two different colors. This is a modified version of the usual stochastic indicator, which has lime and red lines for easy visualization of extreme price zones.
This version of the stochastic indicator makes it quite easy to identify potential trend reversal zones at a glance. Also, including color in the indicator makes it more user-friendly.
For example, a beginner can easily tell when the market has reached a potential extreme zone for a possible trend reversal just by looking at the color of the indicator line.
How to Trade With the Color Metro Stochastic Indicator
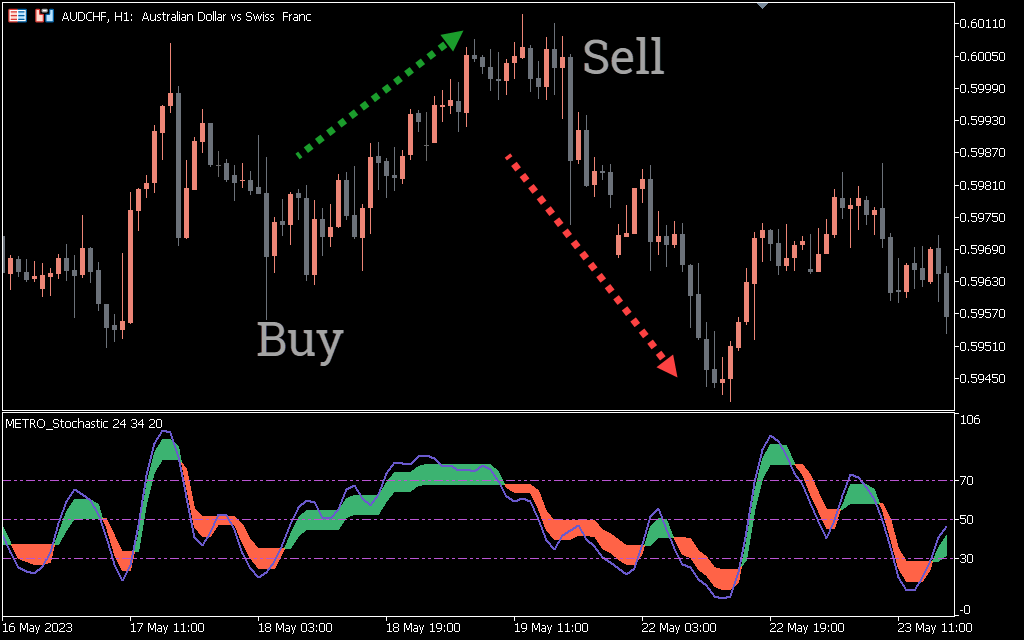
The image above illustrates the effect of the indicator on the AUDCHF pair. The indicator draws a red line for the overbought zone and a green line for the oversold zone, which serves as a sell and buy signal, respectively. This means that you can open a buy or sell position after the indicator line changes to green/red respectively.
In addition, the indicator signal is not recommended to be used in isolation. Therefore, you can use it with price action or any other technical indicator as a confluence before making a trade decision.
Moreover, the Color Metro Stochastic indicator works better in trending markets. Take for example the image above; the market trend was bullish, the indicator line also changed color to light green, and finally, a bullish engulfing candle confirms a buy entry.
Conclusion
The Color Metro Stochastic indicator for MT5 is an updated version of the regular stochastic oscillator, which makes it more attractive to the eye and also effective for identifying overbought/oversold zones.