

VSA Text Indicator
Find out how the spread of a forex pair varies in terms of volume with the VSA Text indicator for MT4.
Description
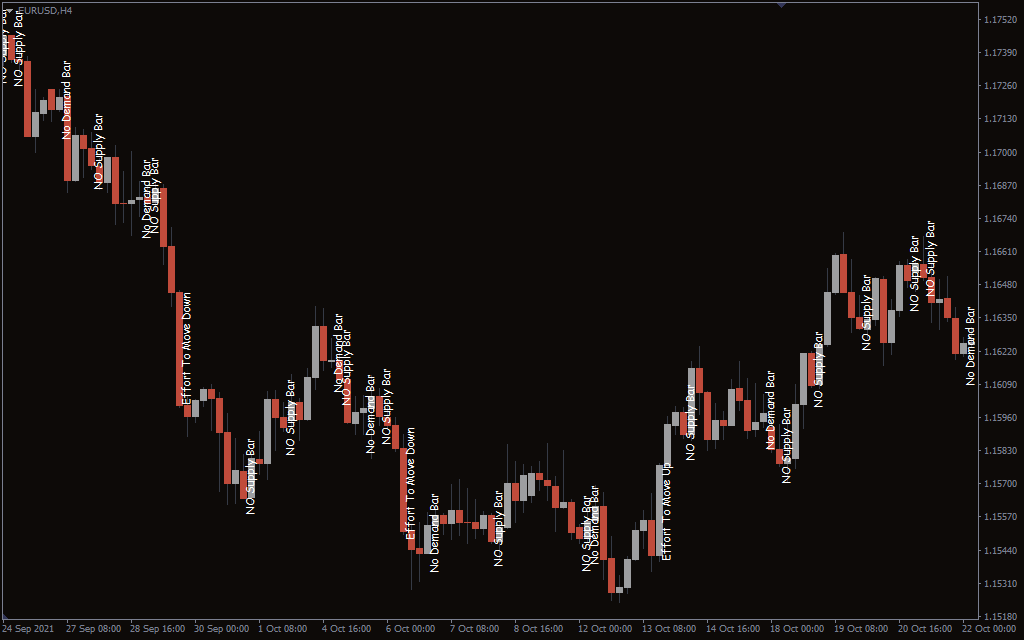
The VSA Text indicator for MT4 is a spread indicator that calculates in terms of volume. VSA stands for volume spread analysis.
The name VSA Text is because it shows vertical Text where the market volume is high or low. It consists of five texts; no supply bar, no demand bar, effort to move up, effort to move down, reverse upthrust, and stopping volume.
No supply bar mentions when there is a little attempt from buyers. The no demand bar suggests when the sellers are reluctant to enter the market.
The effort to move up the bar paints a candlestick moving up. Conversely, the effort to move down the bar draws downward candlestick.
The upthrust bar defines the potential uptrend. On the flip side, the reverse upthrust describes the potential reversal.
The stopping volume simply suggests when there is little to no volume. The indicator works in a correlation between price and volume and gives you an idea of where the market is moving next.
How to trade with the VSA Text indicator?
By painting the Text on the chart, the VSA Text indicator suggests the potential market moves. All of the emphasis of the indicator lies around supply and demand zones.
When the no supply bar pops up, the indicator signals a potential downward trend. On the other hand, when the no demand bar occurs, it signals a potential uptrend.
The upthrust and reverse thrust bar illustrate the potential uptrend or a downtrend. So, you can see the whole picture and take your positions accordingly.
The effort to move up and down bar backs up the upthrust and reverse upthrust bars. When the market makes unexpected moves, these bars reflect the overall market sentiment.
You can use the VSA Text indicator with other technical analysis like support and resistance for signal confirmation. In addition, you can use the indicator on any timeframe as it is based on volume analysis.
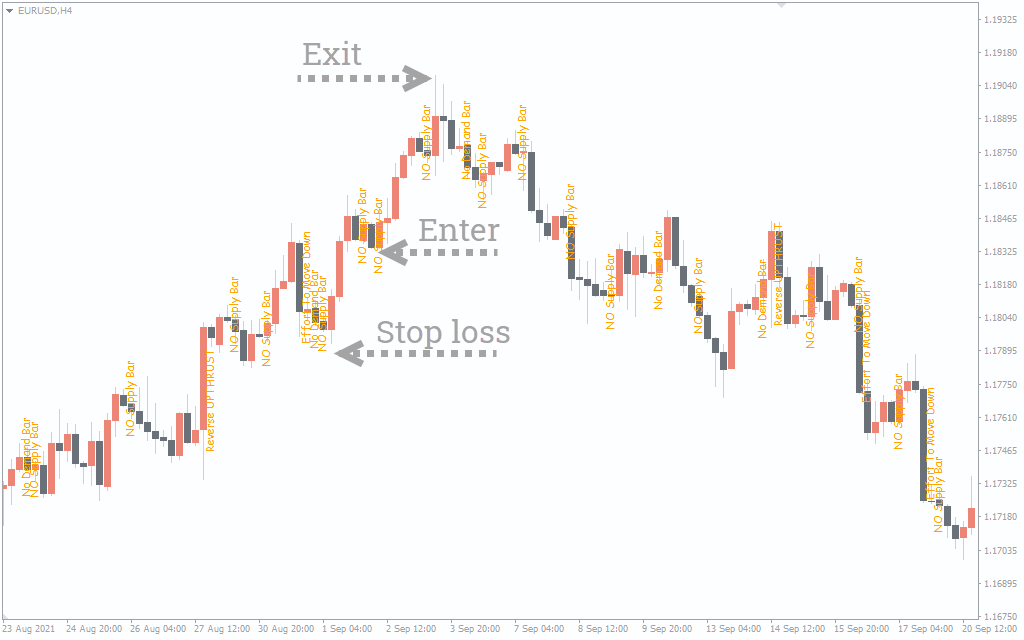
VSA Text indicator buy setup
- Locate the no supply bar on the chart.
- Wait for the trend to fully develop.
- Enter the trade at the no supply bar
- Put a stop-loss near the low of a buying point.
- Exit the trade when the no demand bar appears or when the effort to move down bar emerges.
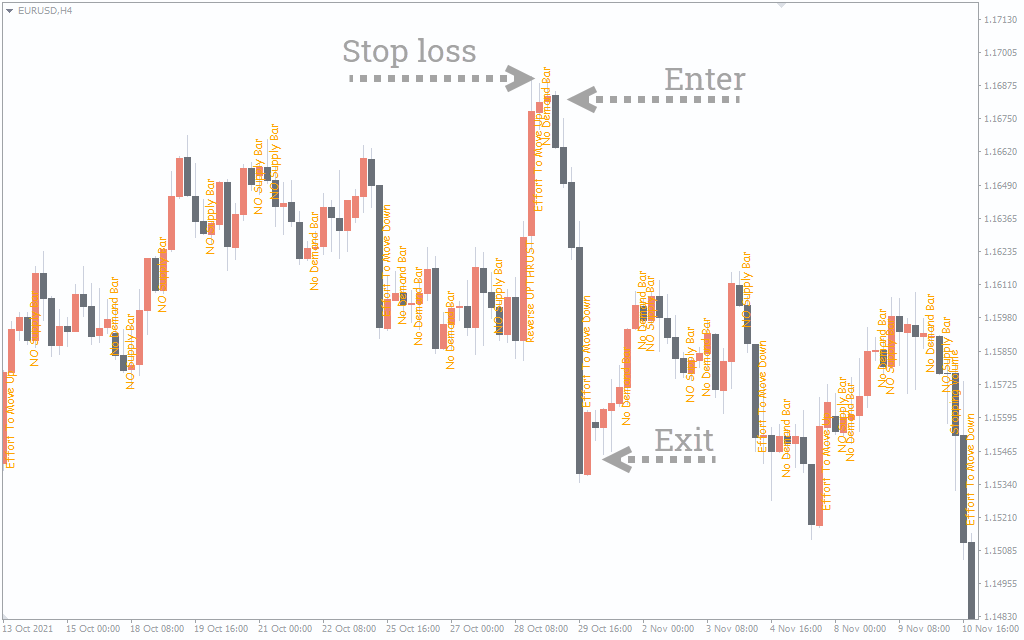
VSA Text indicator sell setup
- Locate the no demand bar on the chart.
- Wait for the trend to fully develop.
- Enter the trade at the no demand bar
- Put a stop-loss near the high of a selling point.
- Exit the trade when the no supply bar appears or when the effort to move up the bar emerges.
Conclusion
The VSA Text indicator is great for detecting the overall market volume. It drawing text bars, it tells you the overall market sentiment. However, the indicator is prone to false signals on shorter timeframes, so it’s better to use it with other volume indicators.