
Trend Signal Indicator
MT4Also Available for MT5The Trend Signal Indicator for MT4 helps forex traders to identify new trends at a quick glance.
Description
Many forex traders want to enter a new trend early and ride it for a long time.
As profitable as this strategy is, only a few indicators can effectively signal a new trend.
One of the best indicators that helps traders to spot a trend is the Trend Signal Indicator.
The Foundation
The Trend Signal Indicator for MT4 helps forex traders to identify new trends at a quick glance.
The diagram below shows the Trend Signal Indicator on the MT4 chart.
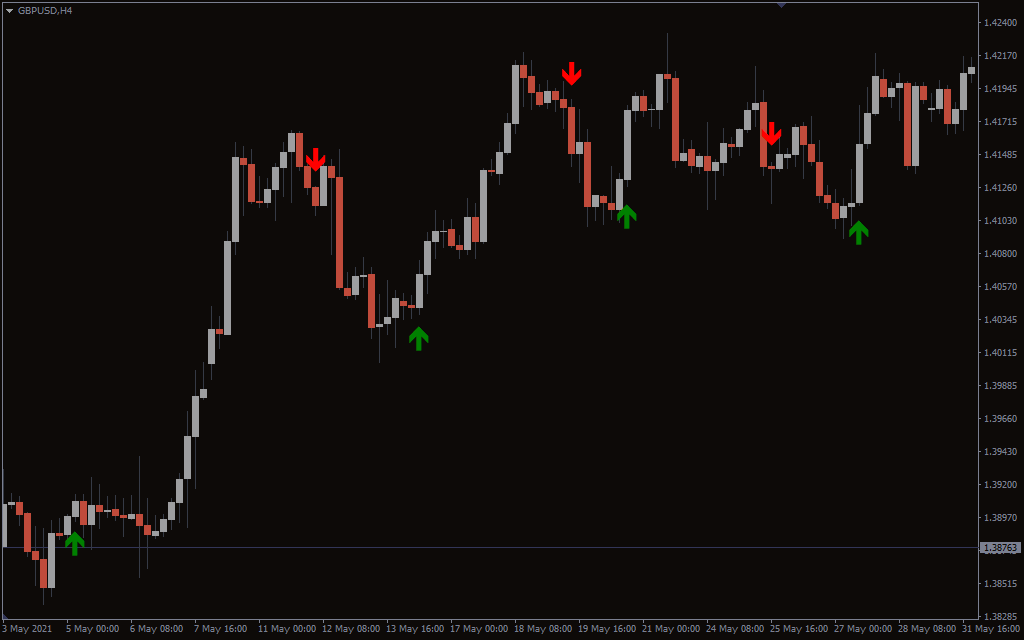
This indicator shows red and green arrows on the GBP/USD H4 chart above.
The red arrows (pointing down) indicate that a downtrend is forming, and the market is bearish.
Consequently, the green arrows (pointing up) signals that an uptrend is forming, and the market is bullish.
This indicator works perfectly in all market conditions and all time frames.
By using this indicator, intraday traders can determine when to open and close trading positions.
This indicator also enables position traders to ride an uptrend or downtrend for long.
How to use the Trend Signal Indicator
The Trend Signal Indicator can be used solely or in combination with other technical indicators.
This indicator can be used for trend, breakout and range trading.
Trend traders can use this indicator to identify dynamic support and resistance zones.
These can help trend traders enter a buy trade in an uptrend or a sell trade in a downtrend.
Furthermore, breakout traders can use this indicator to identify retested support and resistance levels after breakout.
These levels will help breakout traders to place a less risky buy or sell trade.
Range traders can use this indicator to identify reversal levels and place a buy or sell trades.
The GBP/USD H4 chart below shows how to use this indicator on MT4.
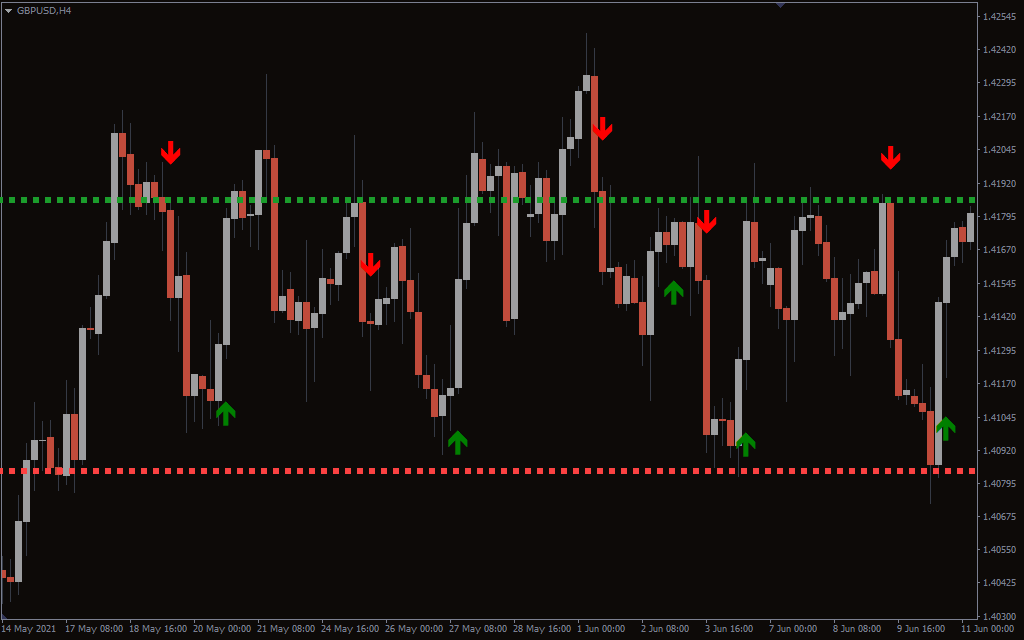
In the chart above, the major support level (red horizontal line) is found at the 1.40847 price.
Consequently, the key resistance zone (green horizontal line) is found around the 1.41862 price.
A buy position can be placed when the green arrow pops up around the support level.
A sell position can be placed when the red arrow pops up around the resistance zone.
Reversal patterns such as bullish or bearish engulfing candles can be used to confirm a buy or sell entry.
Long positions can be closed when a red arrow pops up on the chart.
Short positions can be closed when a green arrow pops up on the chart.
Conclusion
The Trend Signal Indicator for MT4 is one of the best indicator that quickly spot a new trend early.
This indicator works in all market conditions (trending and ranging market) and all time frames.
The indicator can be used solely, but it’s best to use it together with price action and candlestick analysis.

1 2 3 4 5