

TopTrend Indicator
MT4TopTrend is the best MT4 indicator for breakout & trend-following trading. Determines trend reversals & dynamic trend lines. Shows buy-sell entry & exit levels
Description
The TopTrend indicator comprehensively demonstrates trend reversal setups and potential price breakout levels in MetaTrader charts. It uses dynamic support and resistance lines to show the possible event areas of the market where the price decides its next trend direction.
Technically, TopTrend is a good fit for trend-following and breakout traders. Apply it to anticipate trading opportunities for any financial assets, including forex currency pairs, stocks, commodities, cryptocurrencies, and more.
It works well in shorter timeframes but offers more consistent results when applied in longer timeframe charts. According to our review, TopTrend signals in H1, H4, and daily charts are more accurate and consistent.
Moreover, TopTrend applies easy trading rules and simple demonstration of trend insights, making it more suitable for novice traders. Besides, it also offers excellent support to expert traders while conducting price level analysis.
After reading this guide, you’ll learn how to apply the TopTrend indicator for identifying price breakouts and trend reversals to assess potential buy/sell opportunities.
How to trade forex and stock price breakouts in MT4 by using TopTrend Indicator
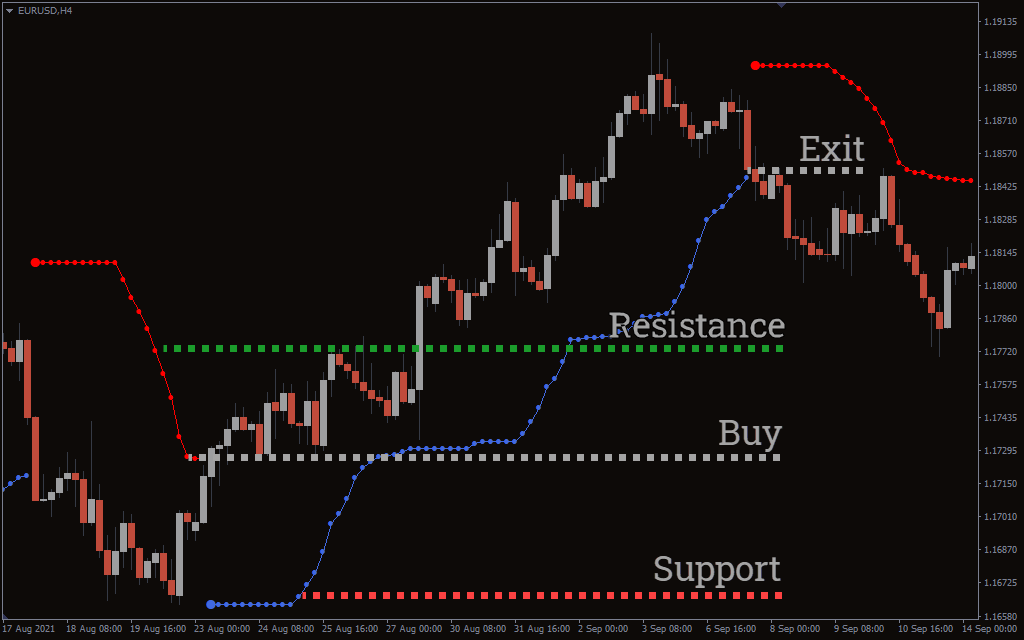
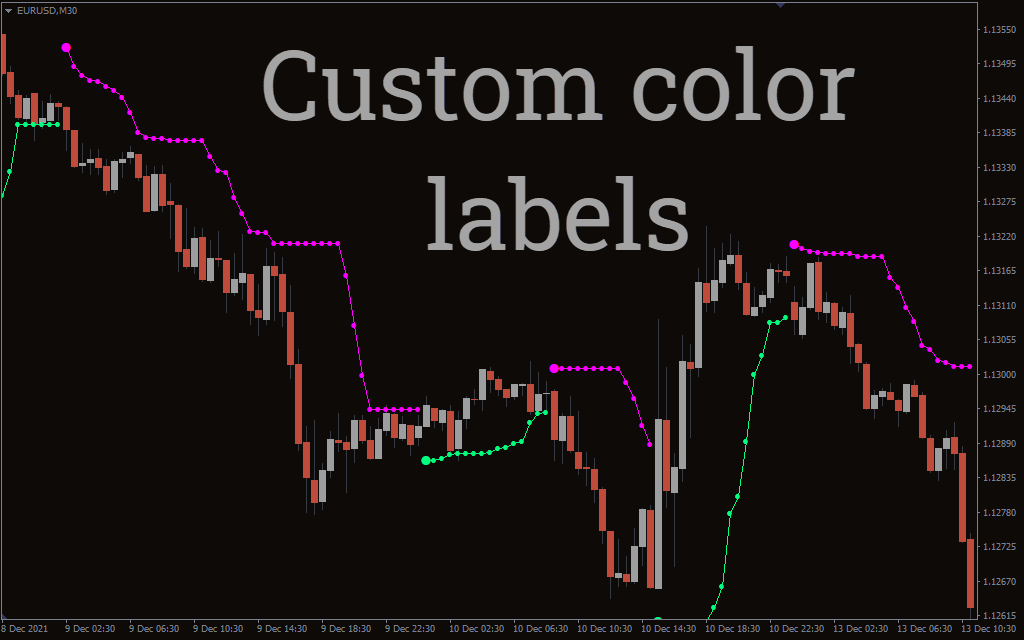
TopTrend applies a 20-period MA with a deviation of 2.0 for plotting the dynamic support/resistance levels. It places a blue line below price candles during uptrend markets, showing the trendline support of the current bullish market. Conversely, a red line above the candles shows the resistance level during a downtrend market.
So, observing whether the indicator plots a support or resistance line on the chart is an easy way to determine the current market trend condition. Once you get a trend confirmation, you can prepare yourself for an upcoming buy/sell order in two different ways.
First, you can wait for a price retracement to the S/R levels so that you can make a pullback entry within the current trend direction. Second, you may look for a price breakout at the support/resistance or to ride a brand new trend.
After you activate an order, try holding your buy or sell position until the price breaks the current S/R level. For instance, if you’re on a buy order, consider profit taking immediately after the price breaks the current support level.
Conclusion
Despite being a trend-based price level indicator, TopTrend plots a trading strategy that guides you through many technical factors like trend signals, breakout levels, entry-exit areas, etc. Beginners admire TopTrend for its classic and straightforward demonstration of both potential price levels and overall market trend conditions simultaneously.
However, it may generate conflicting signals during sidelined market conditions. Therefore, make sure you follow its leads only during highly volatile markets for better results.

1 2 3 4 5