
Three Line Break Indicator
MT5Also Available for MT4Three Line Break is a suitable indicator for identifying and clear showing trend reversal.
Description
Three Line Break Indicator – linear reversal charts are a series of vertical rectangles (lines) whose direction and size are determined by price movements. This type of chart is based on closing prices and does not take into account either timeframe or volume.
The main advantage is the absence of an arbitrarily determined reversal value, as this is signaled by the behavior of the market.
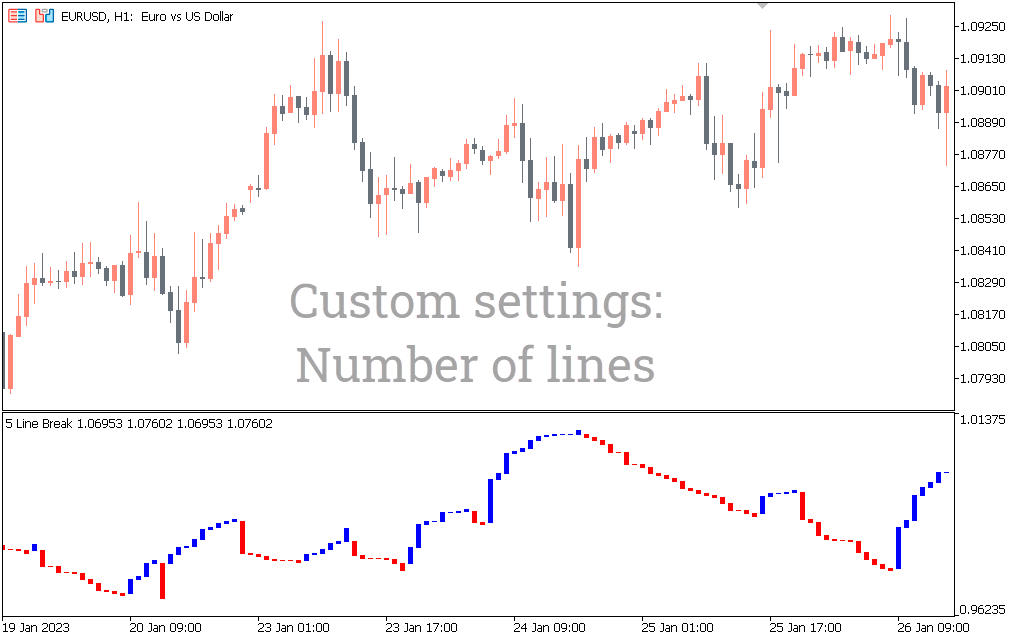
The sensitivity of the three-line breakout chart can be adjusted by changing the number of lines the market must break to project a reversal.
How to Use the Three Line Break Indicator
The general recommendation is to buy after a blue box appears after a series of red boxes and sell after a red box appears after a series of blue boxes. However, as in many cases, the optimal solution of the problem is the enumeration method. Therefore, in my opinion, it is better to use a linear breakdown in combination with other tools and find your own patterns (on TLB charts).
Three line break in real market
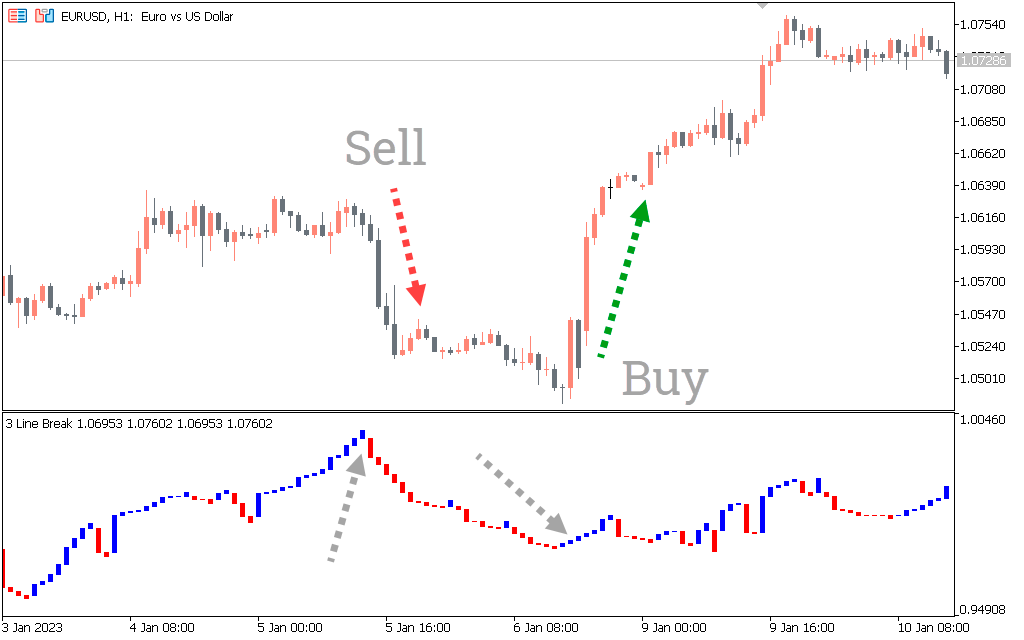
The price action shows the movement of the euro against the New Zealand dollar currency pair on a daily chart. The indicator gives a sell signal during a downtrend.
Similarly, buy when the indicator gives a buy signal and exit when the indicator gives a bearish reversal signal.
Conclusion
The 3-line breakout is an excellent indicator for identifying sell and buy signals using a 3-line breakout strategy. It includes three lines that form as a pullback during a downtrend or an uptrend. You only need to look at the indicator and enter a buy when the indicator shows a bullish signal, and vice versa.
1 2 3 4 5