
Swing Highs-Lows & Candle Patterns Indicator
MT4Also Available for MT5Identify key market turning points with the Swing Highs-Lows & Candle Patterns Indicator for MT4 by LuxAlgo. Perfect for structure-based trading.
Description
The Swing Highs-Lows & Candle Patterns Indicator from LuxAlgo offers a clear and structured way to view market turning points through the combination of swing structure and candlestick patterns. This tool is ideal for traders who prefer to build their strategy around price action, market structure, and reversal patterns. Rather than adding clutter to the chart, this indicator simplifies the reading of swing points, showing whether a swing is a Higher High, Higher Low, Lower High, or Lower Low — with corresponding candlestick signals attached.
It’s an excellent companion for trend traders and reversal traders alike, helping to pinpoint areas of interest with precise labeling and pattern recognition.
Swing Highs-Lows & Candle Patterns Indicator Trading Signals
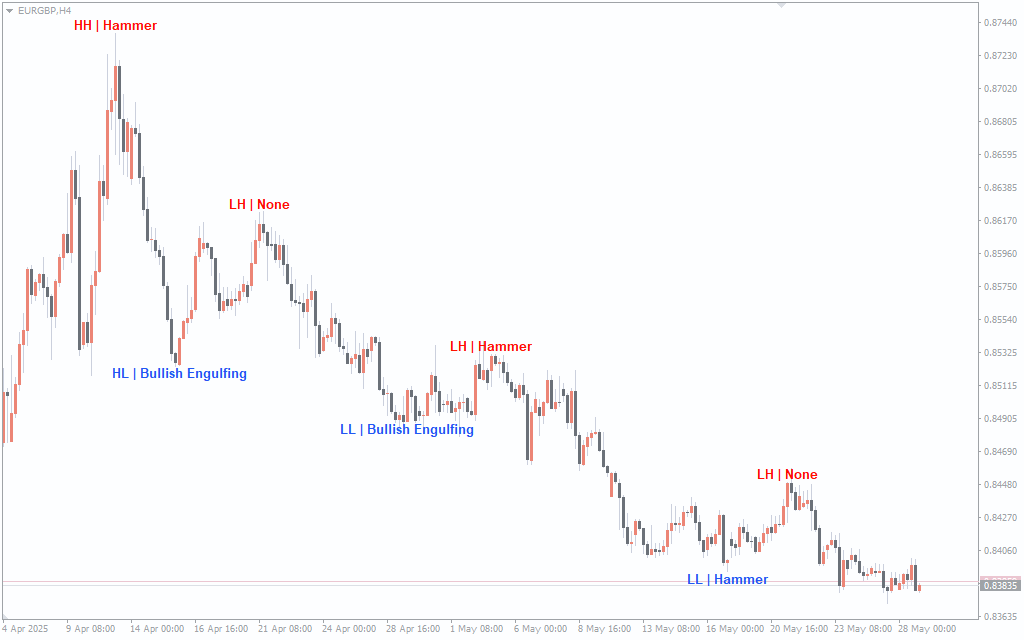
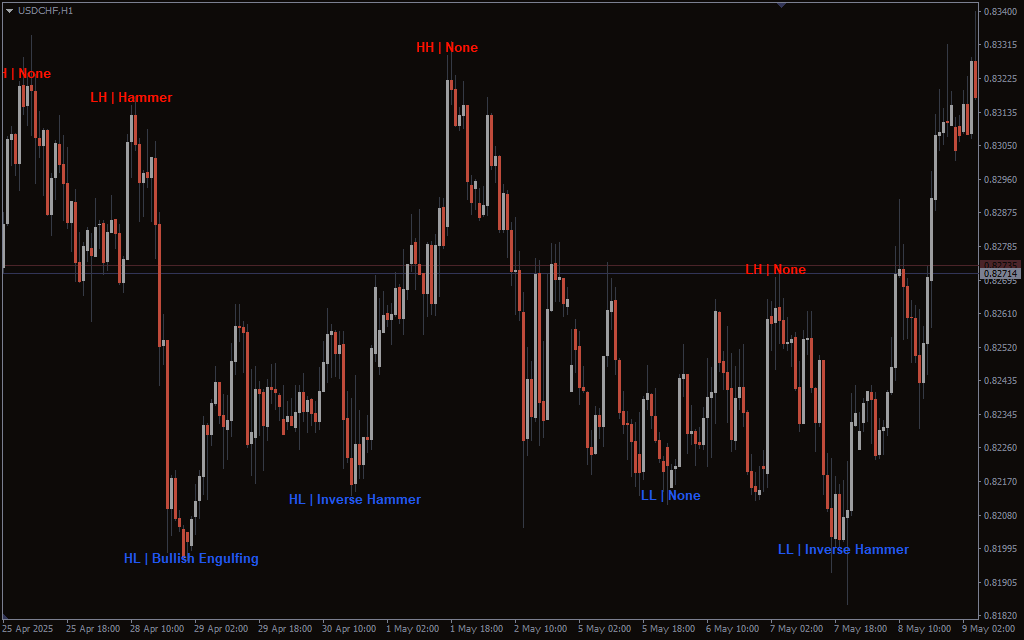
This indicator analyzes market structure to detect swing highs and swing lows based on a user-defined length. Each significant swing is labeled directly on the chart as HH (Higher High), HL (Higher Low), LH (Lower High), or LL (Lower Low), providing instant feedback on trend direction and market structure.
Additionally, the indicator attaches the most relevant candlestick pattern to each swing, such as Bullish Engulfing, Bearish Engulfing, or Hammer. These labels give additional confluence to potential reversal zones. For example, a Higher Low forming with a Bullish Engulfing pattern can signal a strong continuation of the uptrend. Likewise, a Lower High paired with a Hammer may suggest weakening bullish momentum or a potential reversal.
By combining structural labeling with pattern recognition, the indicator helps traders not only see the trend but understand the sentiment behind each market move.
Conclusion
The Swing Highs-Lows & Candle Patterns Indicator is a powerful addition to any trader’s toolkit. It combines structure and candlestick analysis to provide a clear visual map of the market’s behavior. Whether you’re focusing on higher timeframes or intraday scalping, this indicator keeps your chart clean while offering invaluable insights into swing formations and pattern-based reversals. For those who trade based on market structure or candlestick confluence, it’s an easy-to-use, highly effective tool for improving decision-making and trade timing.

1 2 3 4 5