
Supply and Demand Visible Range Indicator
MT5Supply and Demand Visible Range Indicator MT5 highlights key zones and equilibrium levels based on visible price action for precise entries.
Description
The Supply and Demand Visible Range Indicator for MetaTrader 5 is an intelligent tool that automatically detects critical supply and demand zones from the visible part of the chart. Rather than having to rely on static historical estimates, it dynamically reacts to what the trader is looking at on the screen, which helps in making real-time decisions.
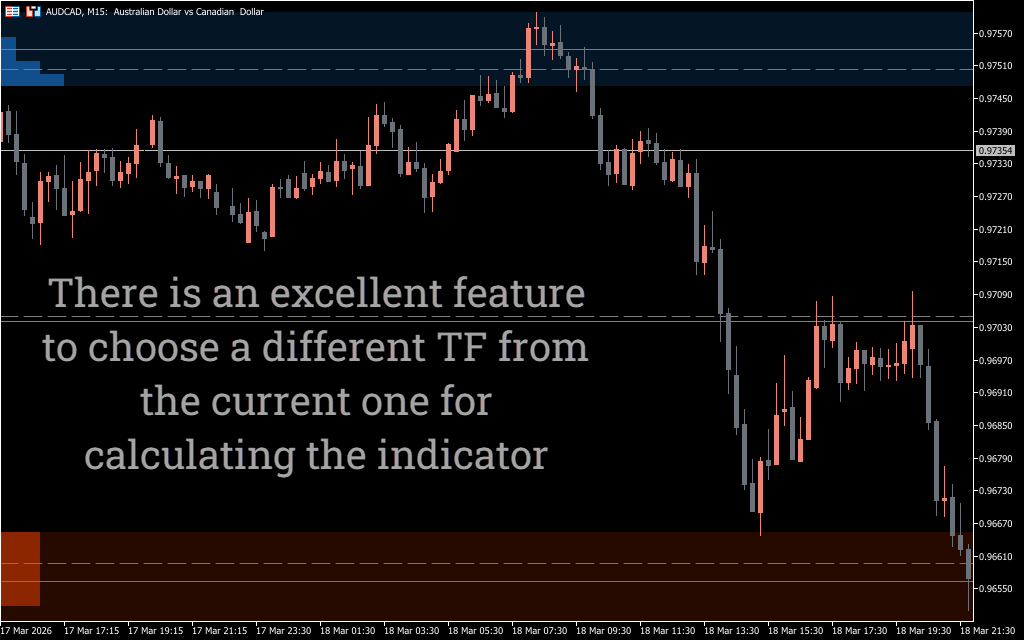
It takes care of a problem that is a challenge many traders have: outdated levels. Conventional supply and demand indicators often compute zones based on a set number of candles, which do not account for the current state of the market. Here, zones are then calculated again, in relation to the visible range, to allow continued analysis of trends in the data.
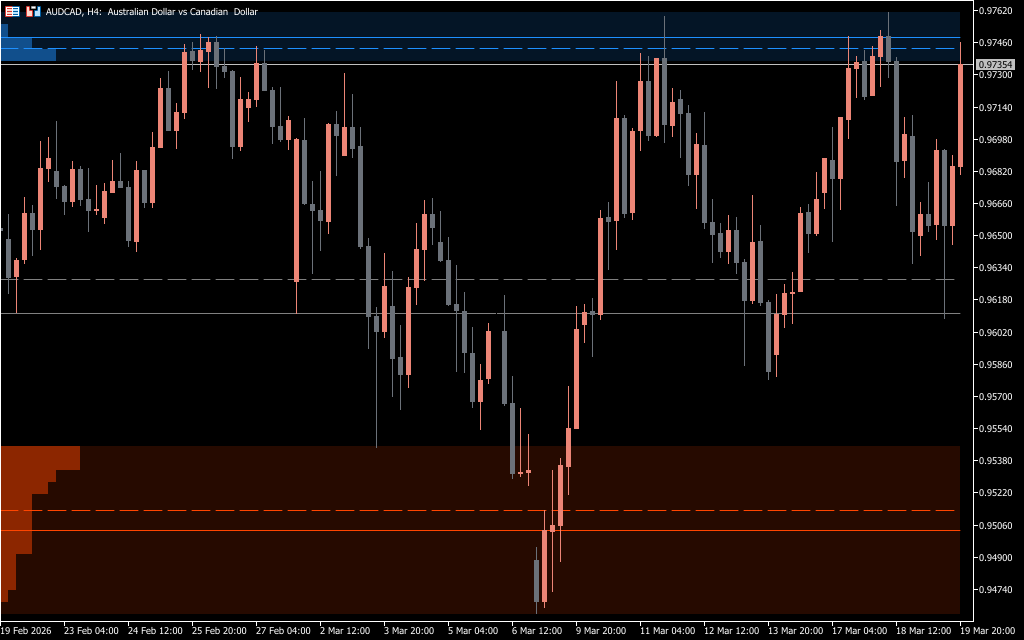
It represents the balance of price between buyers and sellers at an equilibrium level with supply zones (potential selling pressure), demand zones (buying interest), and an equilibrium mark. From a visual standpoint, it makes for a visual and clean structure that lets you quite immediately get a sense of how the market will react.
From my trading point of view this is pretty handy, that’s why tools like this are especially helpful for intraday trading, since context shifts quickly. To also have zones that change on the fly as you scroll and zoom the chart will provide a much better measure of liquidity and market conditions currently.
Supply and Demand Visible Range Indicator MT5 Trading Signals
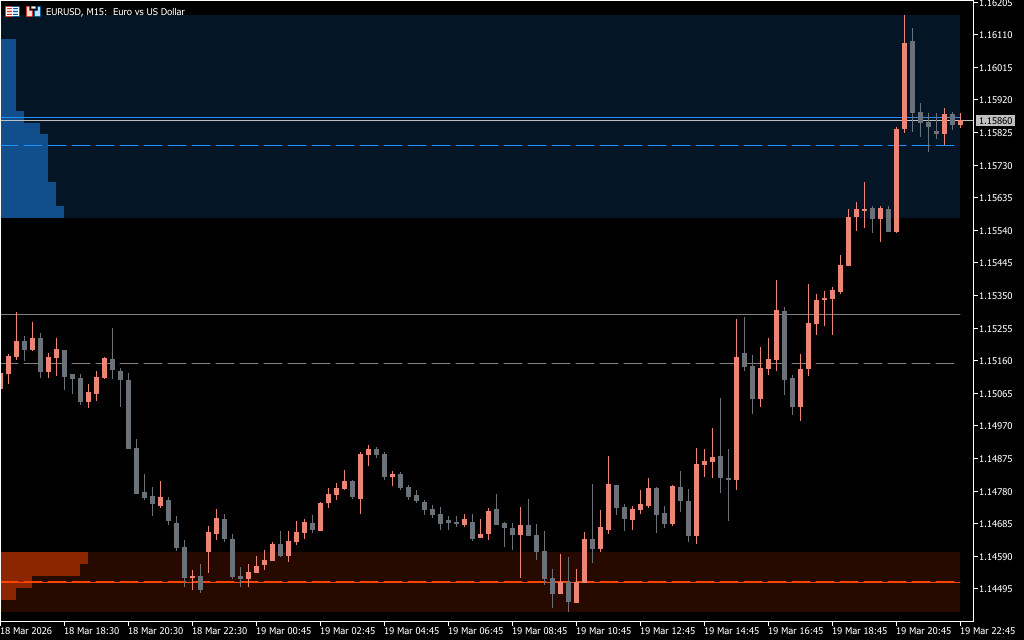
This indicator does not return traditional buy or sell arrows; it gives structural zones to trade in. Price enters into a demand zone, which signals an area where buyers previously stepped in aggressively. If the market returns to this zone, however, it often responds again, creating potential long opportunities.
Supply zones, on the other hand, can illustrate the places where sellers dominated in the past. Price returning to such zones can encounter resistance and, as a result, short setups. Whether price moves towards the zone and generates a certain momentum and how strong the reaction would depend on that.
The balance of market is understood by the equilibrium level. Above equilibrium price usually indicates the market is trading at a premium and below it a discount. That can help filter in entries, especially as you adjust your trades across a wider bias.
That’s what I’ve noticed is that the best trades are typically done when price transitions from equilibrium into one of two zones in its natural order either supply or demand. Rapid rejections from these zones usually signal cleaner entries, while slow consolidation inside them generally reflects weaker setups.
Conclusion
The Supply and Demand Visible Range Indicator MT5 is a powerful visualization tool that brings clarity to market structure by focusing on what truly matters — current price action within the visible chart.
It is especially useful for active traders who need relevant, real-time levels rather than static historical zones. It combines supply, demand, and equilibrium into one clean interface that allows for faster and more confident decision-making.
When used with proper price action confirmation, this indicator can significantly improve entry timing and overall trade quality.

1 2 3 4 5