 System_pre1")
SMC (Hybrid) Trading System
SMC (Hybrid) System review with market structure, order blocks, volume, Gann, TDI, WPR, and trend filters for advanced MT4 traders.
Description
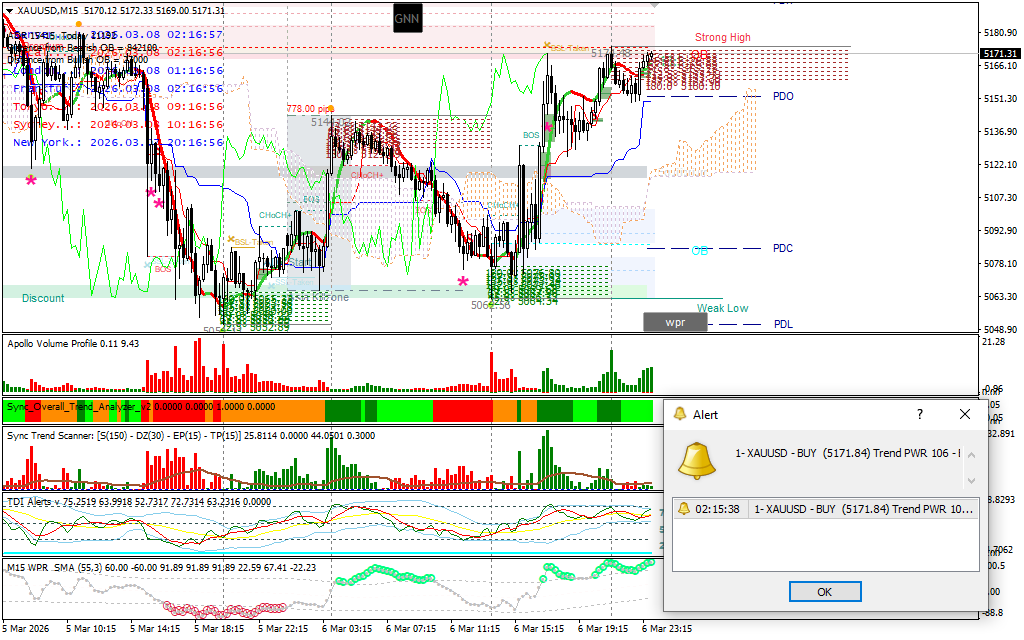
SMC (Hybrid) System is an advanced discretionary trading system based on Smart Market Structure Concepts, ICT Order blocks (with ADR), Order Block Edge, Apollo Volume Profile, Ultimate Smoother (filtered), Gann SQ9 GoldBTV2, and TDI Alerts v3.0 Repaired, WPR (smoothed+vinini BB), and a combined trend layer composed of Sync Numb, Sync Overall Trend Analyzer V2, and Sync Trend Scanner. Instead of a standard ‘signal-following’ template, however, you have this system that aims to support the trader in seeing context, structure, liquidity and momentum together.
Not so easy from the first-hand. It conveys a vast amount of information, but that’s also its strength and its weakness. In skilled hands, it may assist in developing extremely exact entries around order blocks, liquidity zones, displacement moves and continuation structures. When used with little experience, it can be visually overloaded.
For execution, the system is most reasonable for M5 and M15 but M15 and higher give better confirmation from the larger structure. This, in my view, is the kind of template where the indicators are not meant to substitute analysis — they are meant to complement it.
Smart Market Structure Concepts Indicator
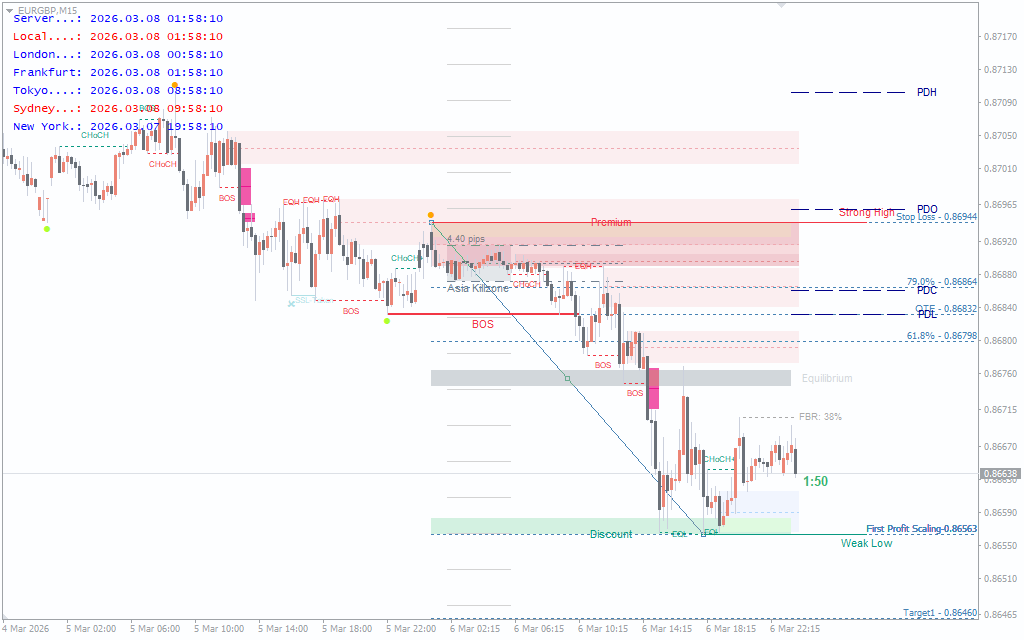
This is the structural backbone of the system. In the chart, it shows the elements of BOS, CHoCH, liquidity references, premium/discount zones, equilibrium, previous day levels, and structural annotations.
What I like about the indicator is that it doesn’t simply show trend direction with this simplified view of things. And try to divide the market into readable stages. And that’s really important because in a pure SMC workflow, the distinction between a valid continuation and a temporary pullback comes down, in many cases, to whether structure has actually changed, or if price is only reacting in the existing dealing range.
What’s more, from an execution perspective, this indicator works best if read sequentially. A simple BOS alone is not enough. When, however, a BOS or CHoCH happens adjacent to a significant liquidity space, inside a premium or discount context, and into an existing imbalance or order block, the read gets a lot stronger. That is where this system begins to exhibit true richness — not in the individual labels, but in overlap through labels.
If you’d like to go into more depth about this indicator or to know how each structural component works for you, here is a full guide.
ICT Order blocks (with ADR) Indicator
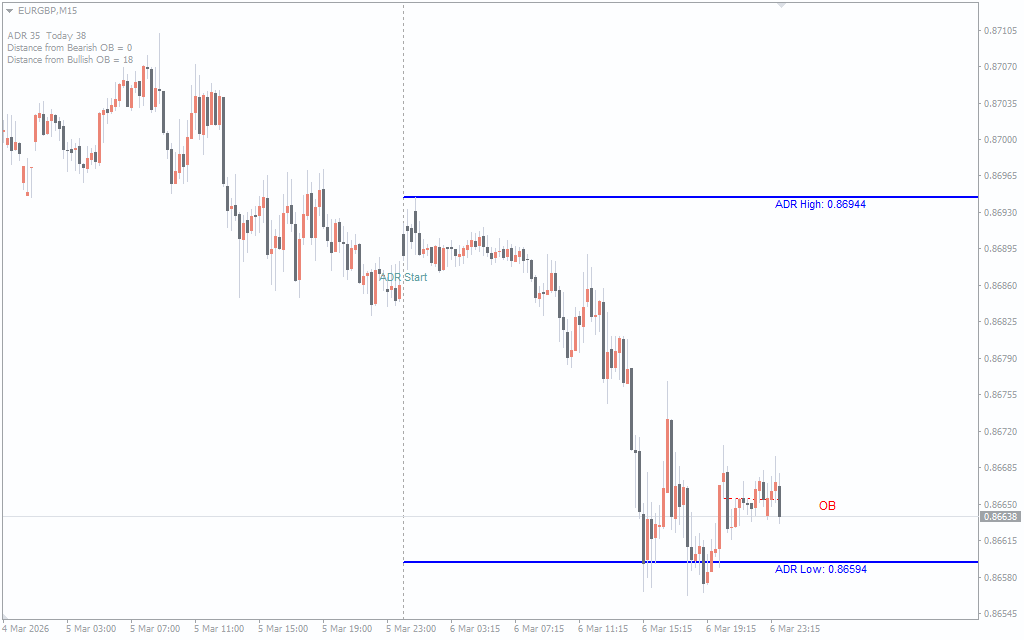
This indicator brings along one of the most useful filters in the entire setup, an institutional-style filter. It plots the order blocks along with ADR boundaries, previous day range references, as well as distance information from active order block zones.
In practice, the ADR component is more relevant than most traders believe. Having a technically valid sell setup that shows up after the price has already extended through most of its average daily range is not the exact same as having a new sell setup created early in the session. The first one tends to have lower continuation potential.
The order block display is also useful in that it allows entries to be framed around reaction zones rather than pursuing candles. When price trades back into a meaningful block while ADR expansion is already stretched, the probability of either hesitation or reversal increases. That does not guarantee a reversal, however, but it provides the trader with a much better decision point than entering in empty space.
Order Block Edge Indicator
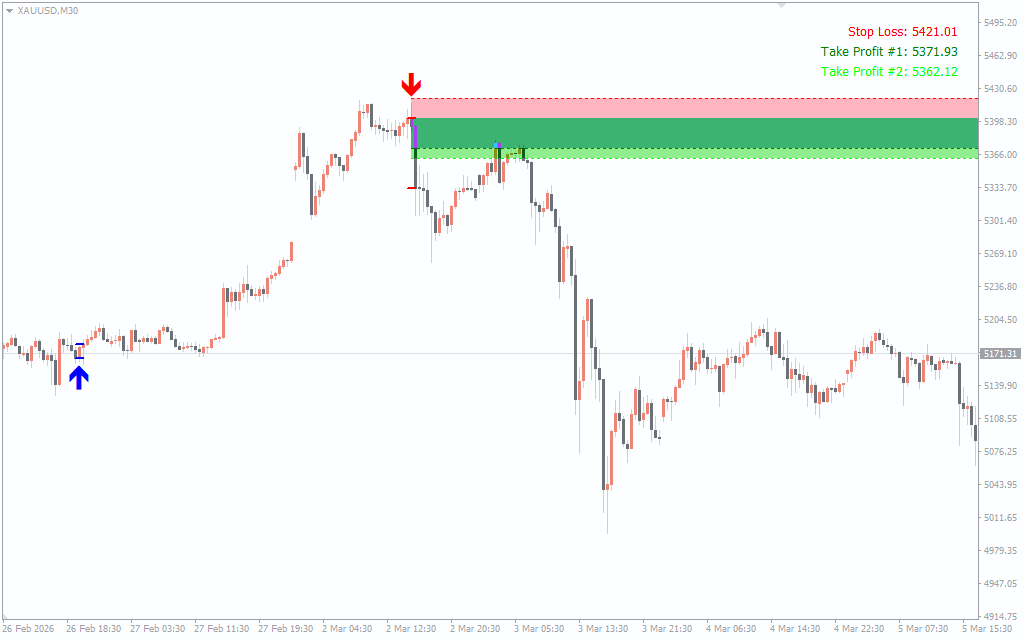
Order Block Edge is the more execution-oriented portion of order block logic. It shows various trade ideas more visually, such as the direction of entry, stop loss, and planned take-profit areas.
It is helpful because SMC traders usually recognize a solid idea but not the best-executed one. A good zone itself is meaningless if the stop is overly loose, the entry is too late, or the target is unrealistic.
The impression I have is that the indicator is much better suited to a structuring tool than to an automatic trade instruction. I find it good for visual planning, especially in the instance that a higher-timeframe block coincides with a local liquidity sweep or rejection. The stronger setups often manifest after the displacement of the projected trade box, not before it. The block, if the market has not shown intent, is simply a potential area and not a confirmed setup.
Apollo Volume Profile Indicator
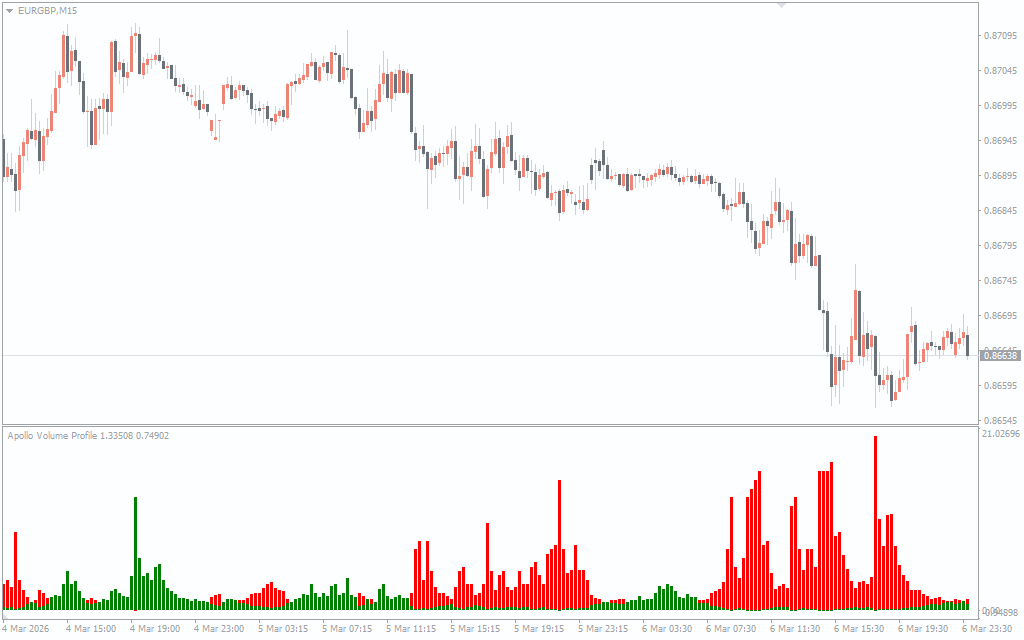
Apollo Volume Profile brings an essential and important missing piece to many SMC templates: participation and pressure. It presents volume behavior under the chart, and it will help uncover where movement is being upheld and where price is drifting with relatively weak commitment.
This is significant because structure per se can be deceiving. Price may break a local level, print a BOS, and fail to convert without real expansion behind the move. Volume helps break forth meaningful displacement from cosmetic movement.
From testing, this metric is particularly helpful around London open, New York open and post-news reactions. When volume expands into a displacement candle that breaks structure, the move deserves to be treated with respect. If structure shifts on weak volume and price remains stuck immediately following, caution is warranted.
Ultimate Smoother (filtered) Indicator
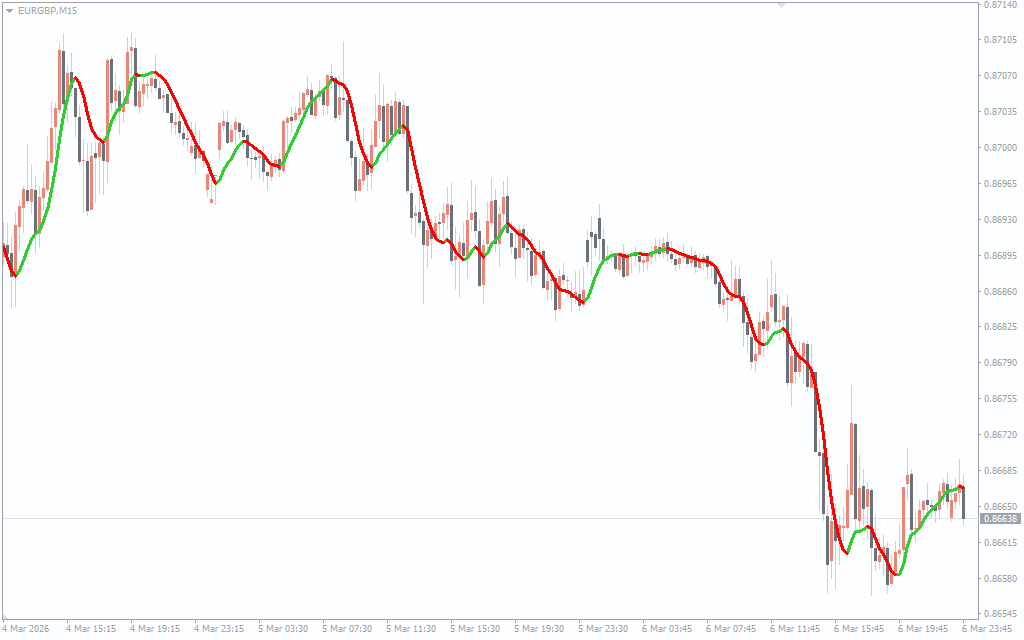
Ultimate Smoother acts like a directional trend filter. It paints a smoothed trend line directly on the chart, switching color as momentum shifts.
On its own, this is insufficient for SMC trading. I would not use it as an independent trigger. But it becomes helpful after the structural read is already formed. If price sweeps liquidity, reacts from a valid zone, and the smoother begins to turn, that gives additional confidence that the reaction is becoming directional rather than remaining random noise.
This is one of those tools that works best as confirmation, not as a reason for entry.
Gann SQ9 GoldBTV2 Indicator
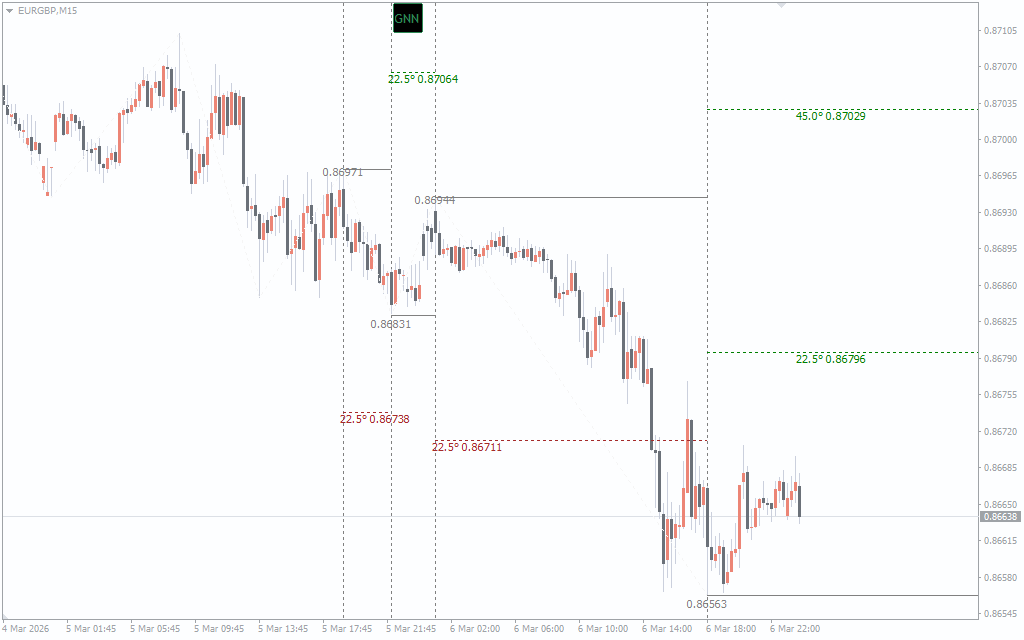
Gann SQ9 GoldBTV2 provides projected levels and directional references that can be useful in mapping possible reaction zones and extension targets, especially on M15 and above.
I wouldn’t use this as a trade idea source but would consider it as a secondary framework tool. Predictions based on Gann are useful where they overlap with existing market structure. It becomes more relevant if the Gann level corresponds to a previous high, an order block edge, a premium zone, or an imbalance boundary.
When used on its own, it could risk becoming too abstract. For confluence it brings another layer of planning quality.
If you would like to learn the logic of this tool in more depth, such as how the Square of Nine calculations work and how traders usually use Gann projections, see a full description on our website here.
Sync Numb + Sync Overall Trend Analyzer V2 + Sync Trend Scanner
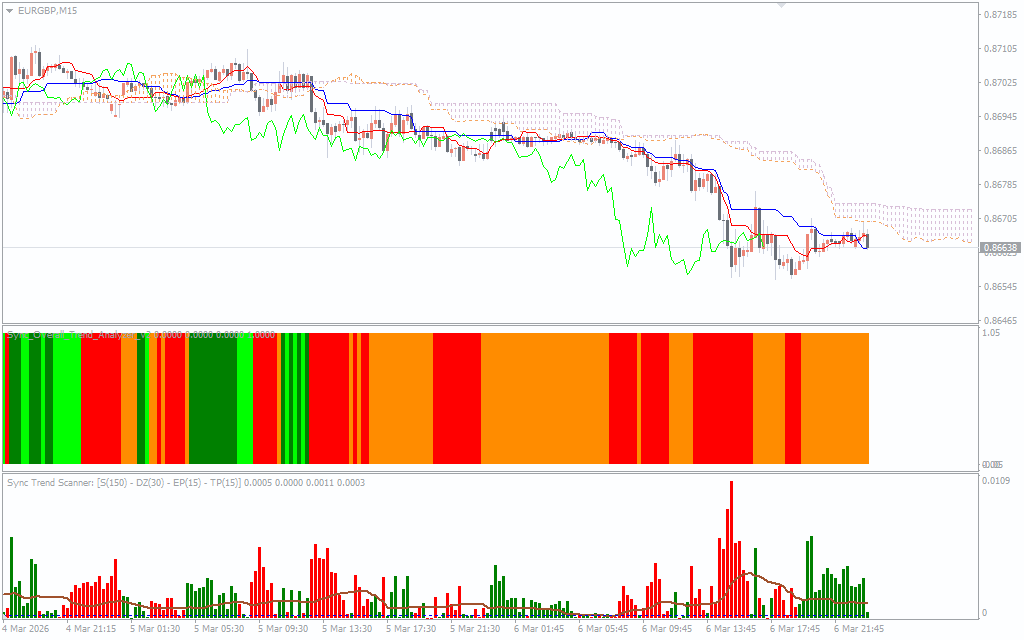
Each of these indicators makes up both the general direction and momentum dashboard of this entire system. Collectively, they present a quick summary of trend pressure, synchronization, and overall market bias.
This is worthwhile since entering against higher-timeframe flow is one of the major problems in discretionary SMC trading. The structure on the execution chart might be alluring, but if the overall directional situation is strong enough against the trade this weakens follow-through.
The most useful practical virtue of this block is not so much in finding entries, but rather in keeping traders oriented on the dominant side. It is all the easier to trade pullbacks and continuations over time when the broader analyzer agrees to them rather than keeping trying to pinpoint reversals just because a local liquidity event occurred.
TDI Alerts v3.0 Repaired Indicator
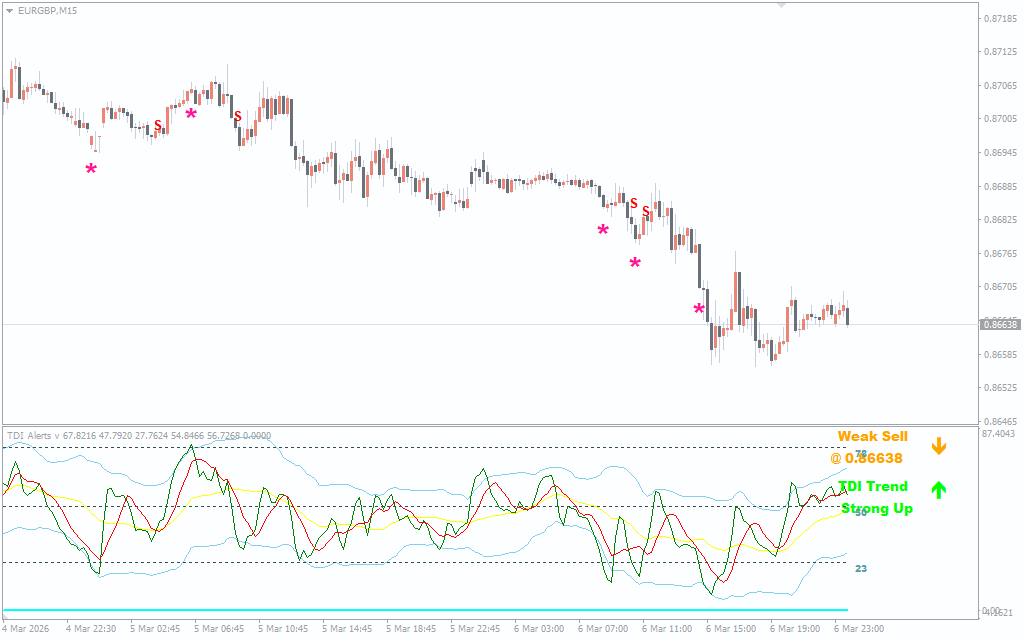
TDI is less the lifeblood of the system however, it is a good momentum and exhaustion monitor – particularly on M15 and up. It’s a nice way of seeing whether a market is already stretched, if trend pressure is fading out, or if there is some room for a reaction to stretch out.
So I view it as a tool to manage trades and perfect timing. If a structurally valid setup has formed but TDI is already deeply extended and its momentum is fading away then it would probably be much better to wait for a better retrace rather than entering immediately.
It is also less relevant for speedy execution on M5. It is more valuable for M15 context.
WPR (smoothed+vinini BB) Indicator
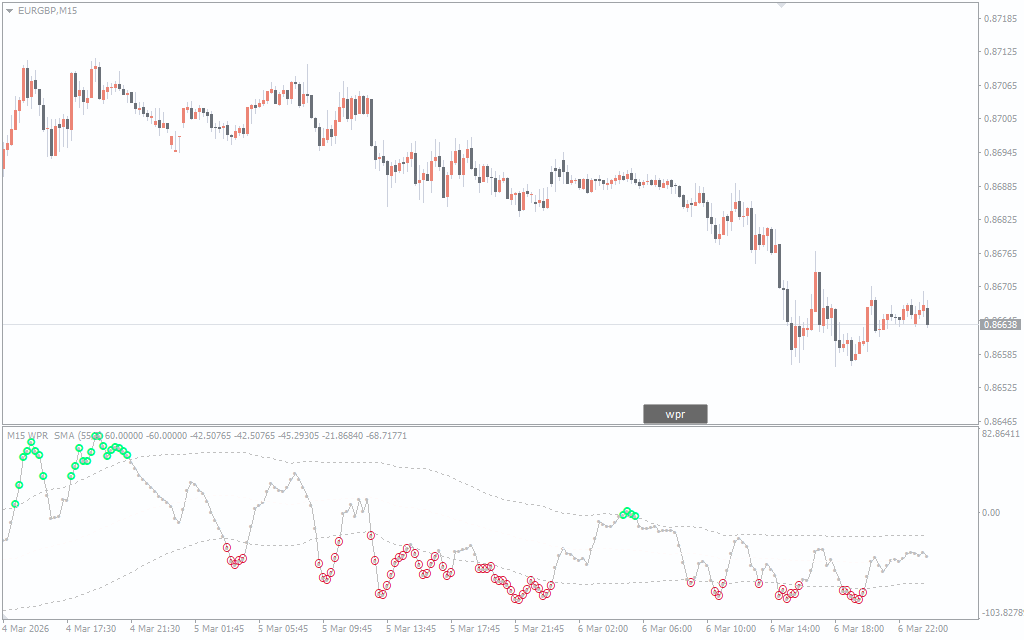
The WPR-based oscillator provides a different perspective on momentum exhaustion and near-term turning pressure. In this template it works as an additional read on whether price is overextended relative to recent movement.
This can help around liquidity grabs and failed breakdowns or failed breakouts. If price reaches a meaningful structural level while WPR is already showing stretched conditions, the reaction setup becomes more interesting.
Still, just like TDI, it should not be treated as the main reason to trade. It is better used to support an existing structural idea.
How SMC (Hybrid) System Works Together
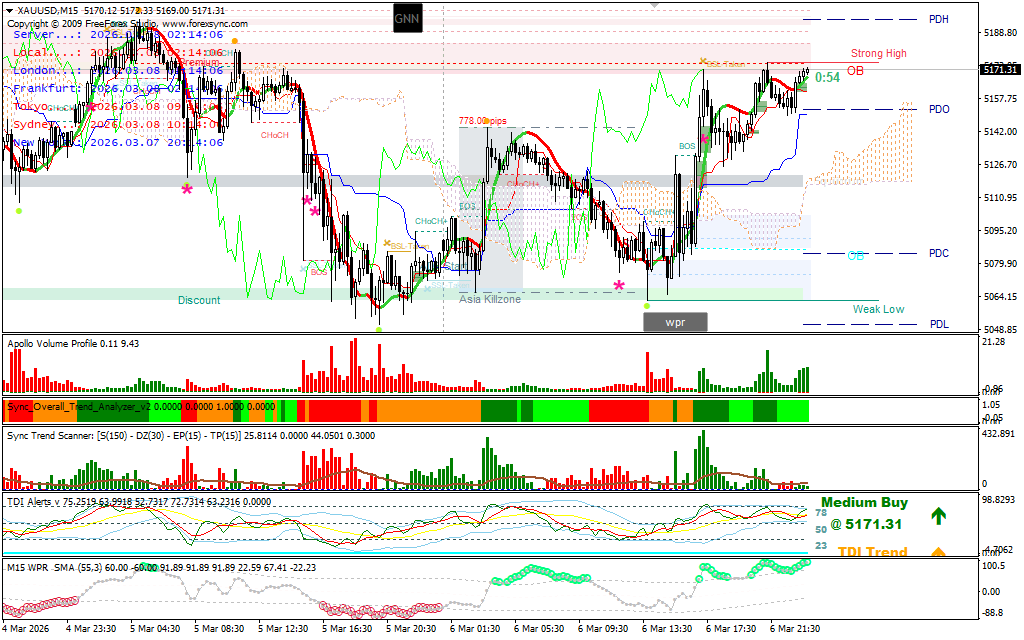
The SMC (Hybrid) System is based on the layered decision-making scheme, not an artificial mechanical signal.
The first layer is the market structure. Smart Market Structure Concepts determines if price is breaking structure, shifting character, trading in premium or discount, or approaching known liquidity pools. This gives the narrative.
The second layer is location. ICT Order blocks, Order Block Edge, and previous day/ADR references help determine whether price is reacting from a place where a move should logically start or end. This is critical. So many weak trades come not from bad direction analysis, but entering in the wrong place.
Then there is the third layer: confirmation. Ultimate Smoother, Trend Analyzer, Trend Scanner, TDI, and WPR check whether momentum seems to be starting to support the structural idea. Apollo Volume Profile serves then to determine whether the move has actual participation behind it.
In practice, the best setups generally go like this: price sweeps liquidity or arrives at significant premium/discount area; taps a valid order block or imbalance; prints a structural reaction; and then sees confirmation from trend or momentum measurement tools. This sequence is so much more important than any one indicator reading. It rewards traders who grasp what cause and effect is in market behavior, unlike traders who respond to whatever appears first up on a chart.
Another key aspect is that this architecture enables both early and confirmed entries. Early entries derive from powerful structural conviction inside of a quality zone. Once indicators hit consensus, confirmed entries appear in sequence. The trade-off is evident: Early entries provide a better price and reward-to-risk whereas confirmed entries offer safety but often come at the cost of worse positioning. An experienced trader can choose either version to work with based on changes in market conditions, volatility at the time, and confidence in the read.
SMC (Hybrid) Trading Rules
Since the SMC (Hybrid) System is based on market structure and liquidity concepts, trades are taken when three elements align: structure shift, reaction from a key zone, and momentum confirmation.
Entry Conditions
- Market structure shift appears (BOS or CHoCH) or liquidity is taken (BSL/SSL).
- Price reacts from a key zone such as an order block, imbalance, premium/discount area, or significant support/resistance level.
- Momentum indicators (Ultimate Smoother, Trend Analyzer, TDI, or WPR) begin confirming directional pressure.
- Entry is taken after a clear reaction candle or lower-timeframe confirmation.
Direction
- Buy trades are considered when reactions occur in discount areas or bullish order blocks.
- Sell trades are considered when reactions occur in premium areas or bearish order blocks.
Conclusion
SMC (Hybrid) System is an example of a comprehensive discretionary framework for traders who wish to integrate Smart Money Concepts, order block logic, liquidity analysis, trend filtering, and momentum confirmation in one space.
Its primary strength is not ease, but profundity. It helps the trader build context before entering, which is something that is not the case in most standard indicator systems. Rather than provide only information about whether the market is “up” or “down,” it provides you with mechanisms for understanding why price is shifting, where it’s most likely responding, and if that response is worth paying attention to.
Yet, it’s not a plug-and-play process. It is highly skill-dependent. The amount of information can be daunting without a deep understanding of market structure, liquidity, and execution logic. Or in shorthand: the template makes a good read better, but it cannot build one.
The system’s best solution should be for traders with some experience with SMC or discretionary intraday trading who want to plan two steps ahead rather than react.

1 2 3 4 5