
Resistance Line Indicator
MT4Resistance Line Indicator For MT4 automatically plots the resistance line on any forex price chart. Best indicator for trend line and resistance trading.
Description
The Resistance Line indicator for MT4 automatically plots the resistance line on any give price chart. So, forex traders using support and resistance will be able to plot them without trader discretion. This helps traders to eliminate errors in plotting the correct and best resistance lines.
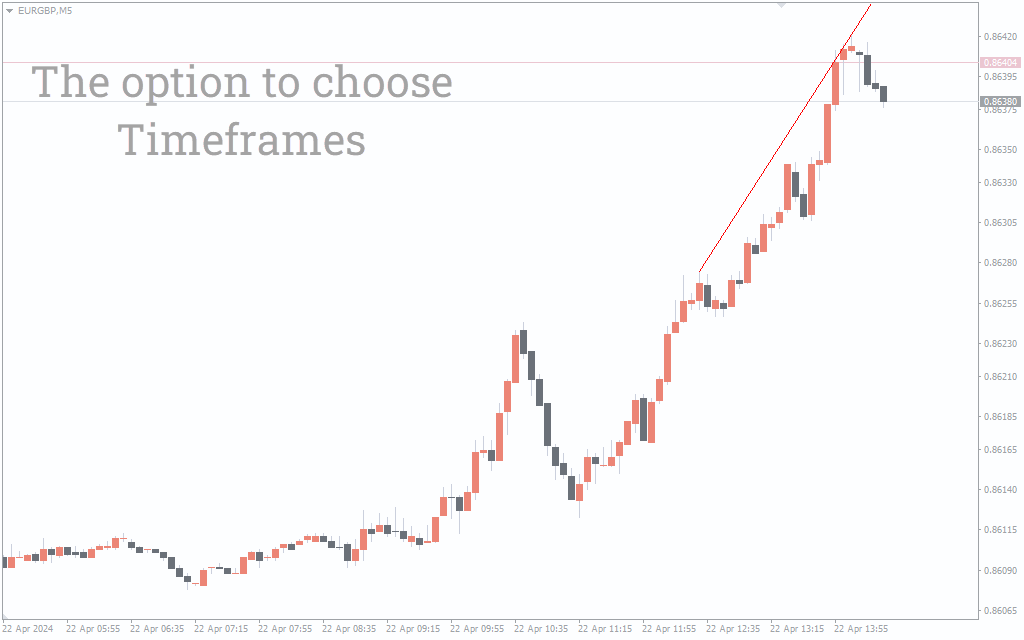
The indicator is very effective for new or beginner level forex traders as it automates the identification of the resistance. Additionally, traders use this indicator to plot the lines on any intraday chart time frames as well as the daily, weekly and monthly price charts. Furthermore, traders can use this as a filter for trading signals of automated trading systems.
Resistance Line Indicator For MT4 Trade Setup
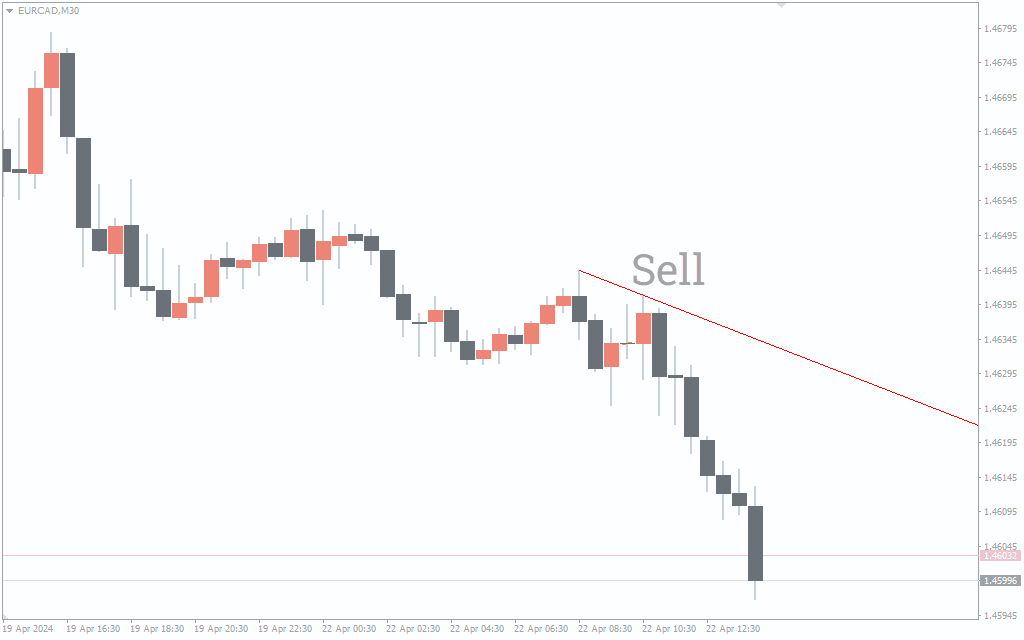
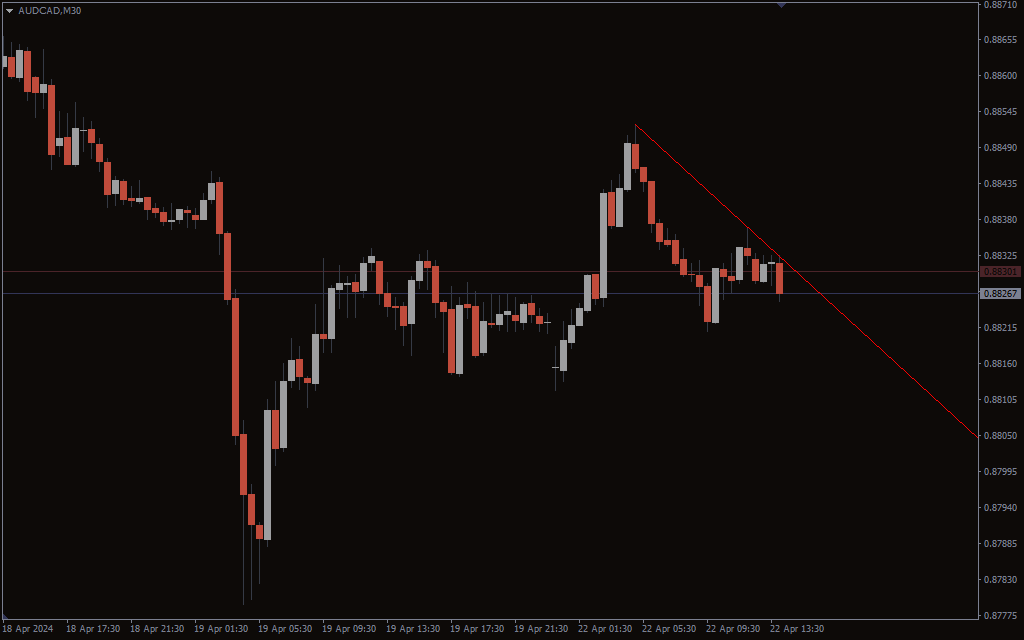
The indicator plots the resistance line as a red trend line. It dynamically changes and redraws as the price moves and adjusts according to the new price information. The best trading strategy is based on the trend line break rules and support and resistance trading rules.
In simple terms, as long as the price stays below the resistance line it is bearish. So, traders should look to enter sell positions below the resistance line. Similarly, traders should hold the positions and ride the bearish trend as long as price respects this down trend line or resistance line.
Indeed, this indicator is a boon to the new or beginner forex traders as the dynamic nature reflects the changing market conditions. This in turn helps the trader to adjust the existing open positions or prepare new trading strategy anticipating the market shift in advance.
Conclusion
In summary, the Resistance Line indicator for MT4 is an essential technical analysis tool for new forex traders.

1 2 3 4 5