
Rate Of Change Indicator
MT5Also Available for MT4Rate Of Change indicator for MT5. The best bullish and bearish forex trading signals based on oscillators. Zero line signal and breakout trading.
Description
The Rate Of Change indicator for MT5 or ROC calculates the rate of price change between the current closing price and the closing price up to “n” periods. The indicator provides bullish and bearish trend reversal signals, so forex traders can place BUY or SELL trades based on them.
In addition, the indicator provides forex trading signals based on divergence and convergence. In addition, forex traders can anticipate reversals and exit early based on the overbought and oversold conditions of the oscillator.
The indicator reflects the momentum of the price and helps the trader to interpret the values of the oscillator and trade the signals in several ways. Thus, the indicator is very useful for beginner forex traders to identify entry and exit points.
However, advanced forex traders can apply convergence and divergence techniques and display support and resistance levels on the indicator to trade complex technical trading strategies. Since the indicator does not have an upper or lower value limit, advanced traders should use oversold and overbought conditions with caution. In addition, the indicator is free to download and easy to install.
Rate Of Change Indicator For MT5 Trading Signals
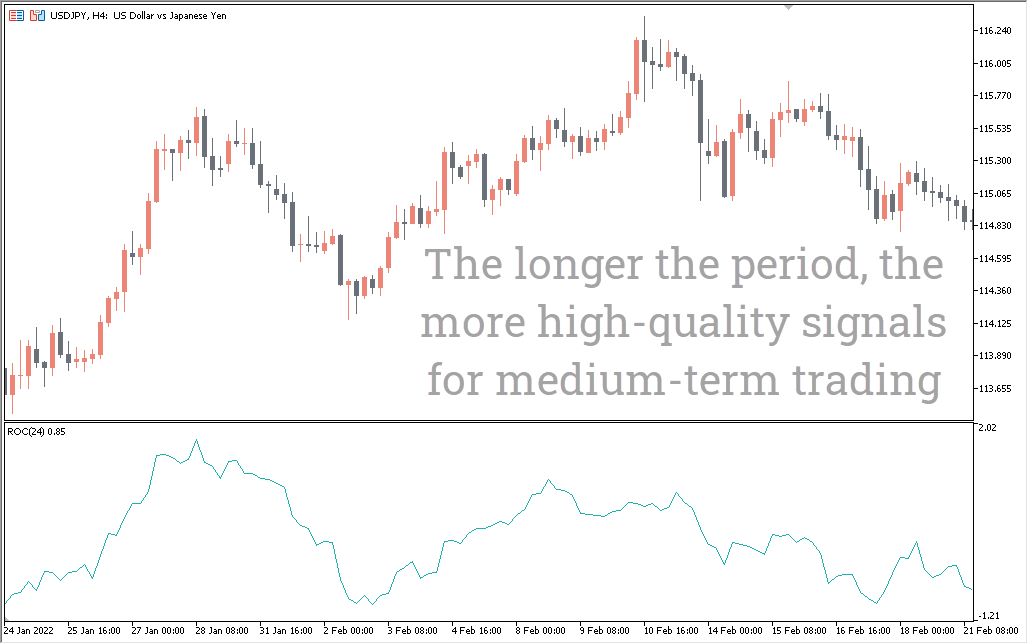
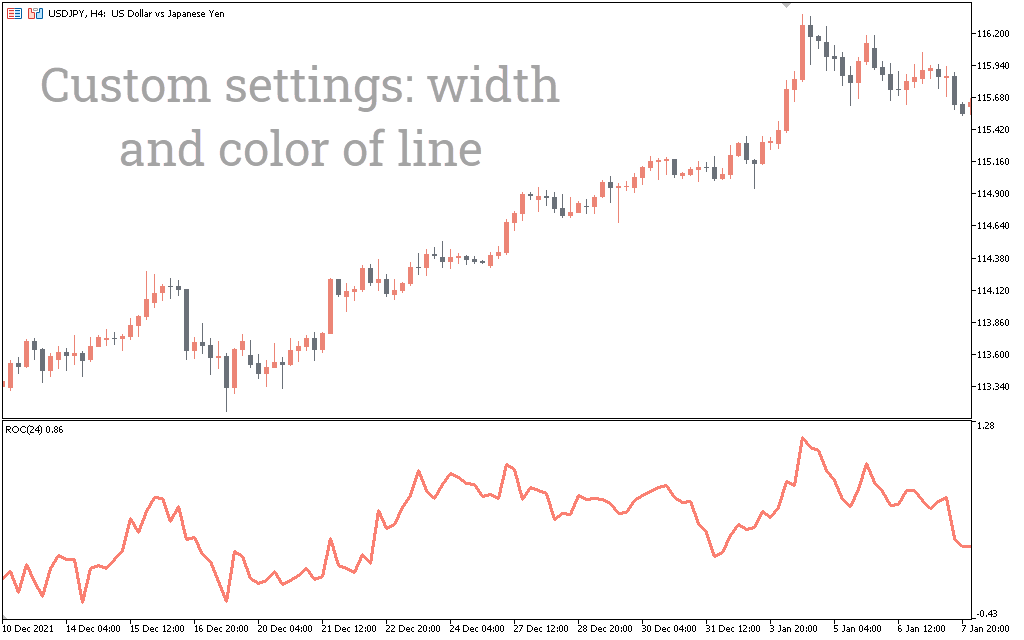
The USDJPY H4 chart above shows the ROC – Rate of change indicator for MT5 in action. The indicator displays values in Seagreen color in a separate indicator window as an oscillator with a zero line without an upper or lower limit.
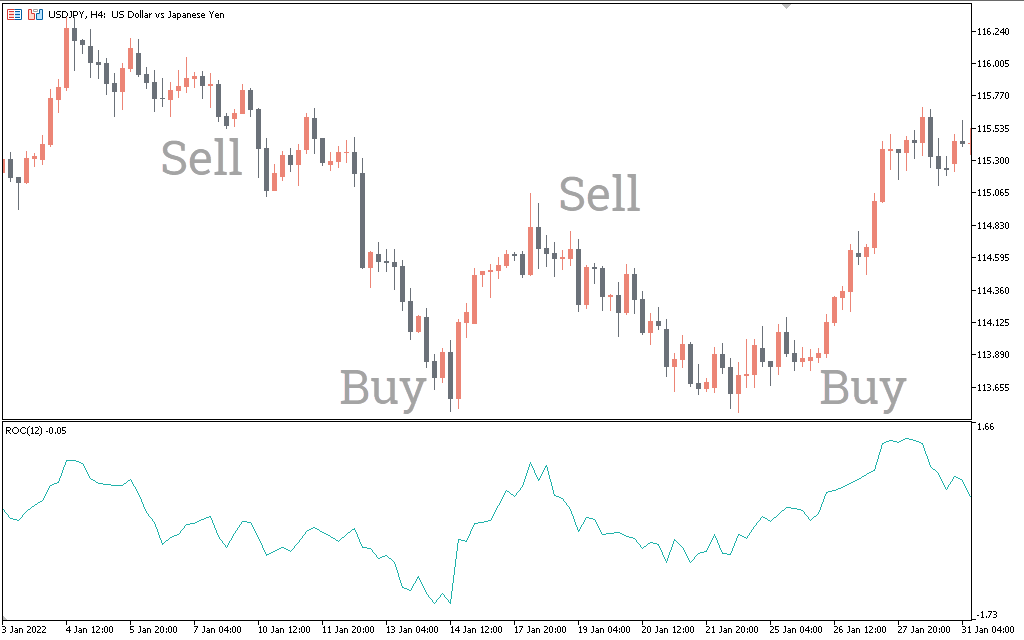
The main method of searching for trading signals is crossing the zero line of the indicator. If the oscillator crosses the zero line from below, it indicates a BULLISH price trend.
Thus, forex traders can place a BUY trade with a stop loss below the previous swing low. The best take profit strategy is to follow the oscillator and stay in position as long as the indicator stays above the zero line. On the other hand, if the oscillator falls below the zero line, it indicates a BEAR market trend. Traders can enter a SELL position with a stop above the previous swing high.
If the oscillator rises sharply from the zero line, this indicates a strong BULLISH trend, similarly, a sharp drop from the zero line indicates a stronger BEAR market trend.
The next important method is to identify the divergence and convergence of the price and the indicator. Divergence or convergence shows a discrepancy between the values of the price and the Rate Of Change indicator. Thus, forex traders can use a BULL or BEAR divergence trading strategy to BUY and SELL respectively.
The third method is to plot support and resistance levels, the basis of technical analysis. Forex traders can plot support and resistance lines and draw channels on the indicator. Forex technical traders can trade breakouts in line with price action.
Conclusion
The Rate Of Change indicator for MT5 provides an opportunity to trade on trading signals using various methods. But traders should be wary of forex indicator trading signals. Calculations are based only on the rate of change of the closing price. Thus, they have a certain lag in bullish and bearish trading signals. Thus, forex traders should apply other technical indicators and trade confluently.
1 2 3 4 5