
Mcginley Dynamic Average Indicator
MT5Also Available for MT4Mcginley Dynamic Average is the best automatic trend indicator for MT5. Offers super trend alerts for day traders in Forex and stocks. A classic technical tool for beginners.
Description
The Mcginley Dynamic Average is a trend indicator in MetaTrader 5. It comes with a classic moving average that compares the current price position to its dynamic trend line to determine the current trend conditions.
Using a single moving average is probably the easiest option for beginner traders to start trading with the trend. It is only required to assess whether the price is moving above or below the dynamic trend line.
Mcginley Dynamic Average Indicator for MT5 Trend Alerts
The Mcginley Dynamic Average indicator is the best choice for trend based day trading in terms of sensitivity and speed. It takes into account recent price movements more, responds quickly to real-time trend alerts, and maintains ultra-accurate signals. On the other hand, simple moving averages lag a lot, and exponential moving averages often give false signals on shorter timeframes.
This guide discusses how to spot potential buy/sell signals using the trend alert Mcginley Dynamic Average Indicator in MT5.
How to anticipate profitable buy-sell signals by using the Mcginley Dynamic Average Indicator in MT5?
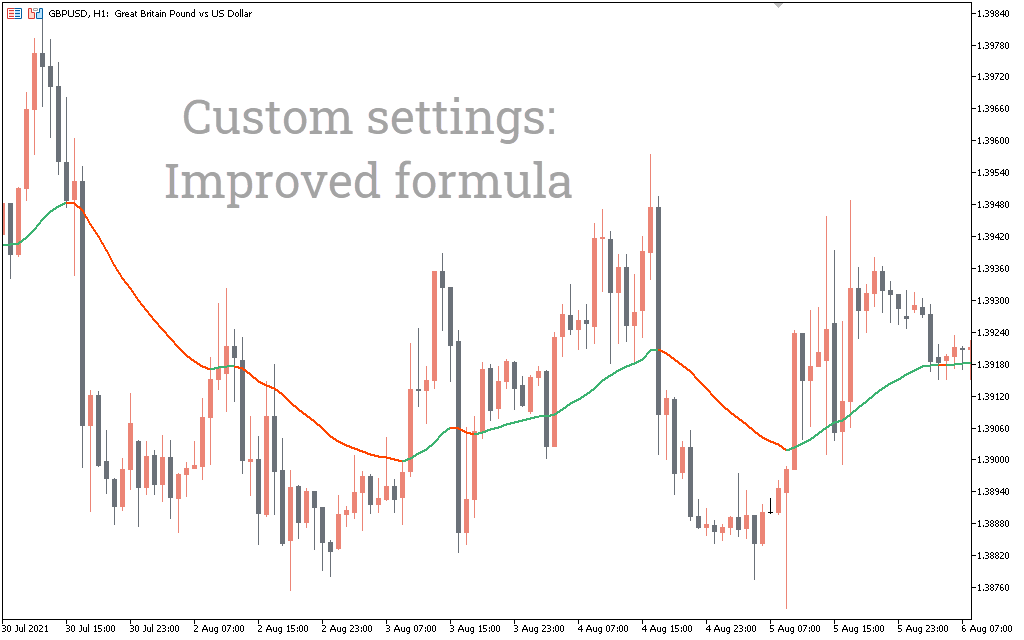
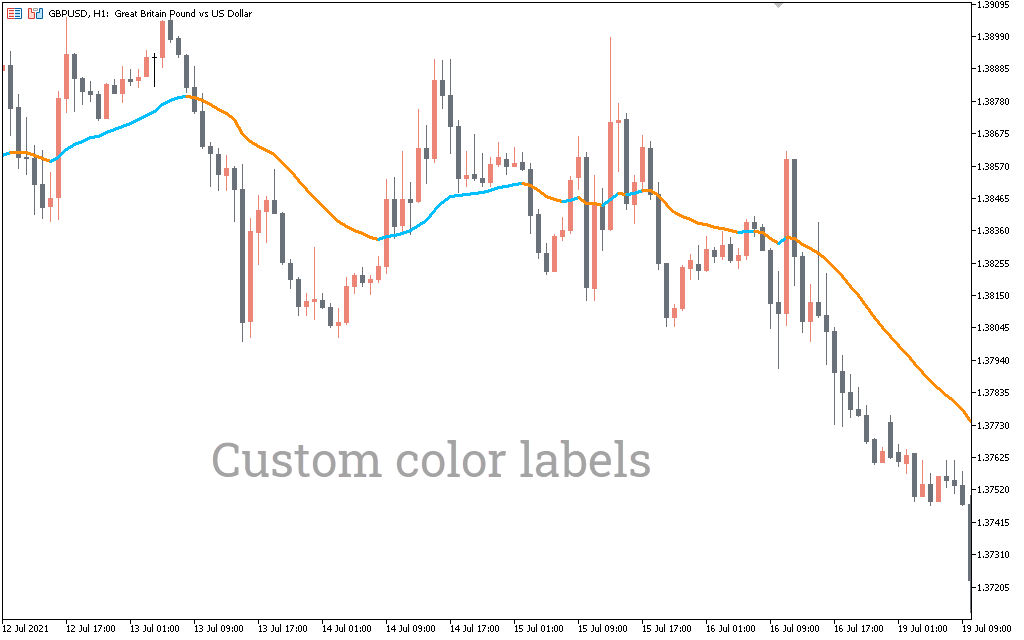
The Mcginley Dynamic Average indicator uses a 12-period moving average to identify potential trend reversal zones. However, you can change the period value to adjust the signal frequency as needed.
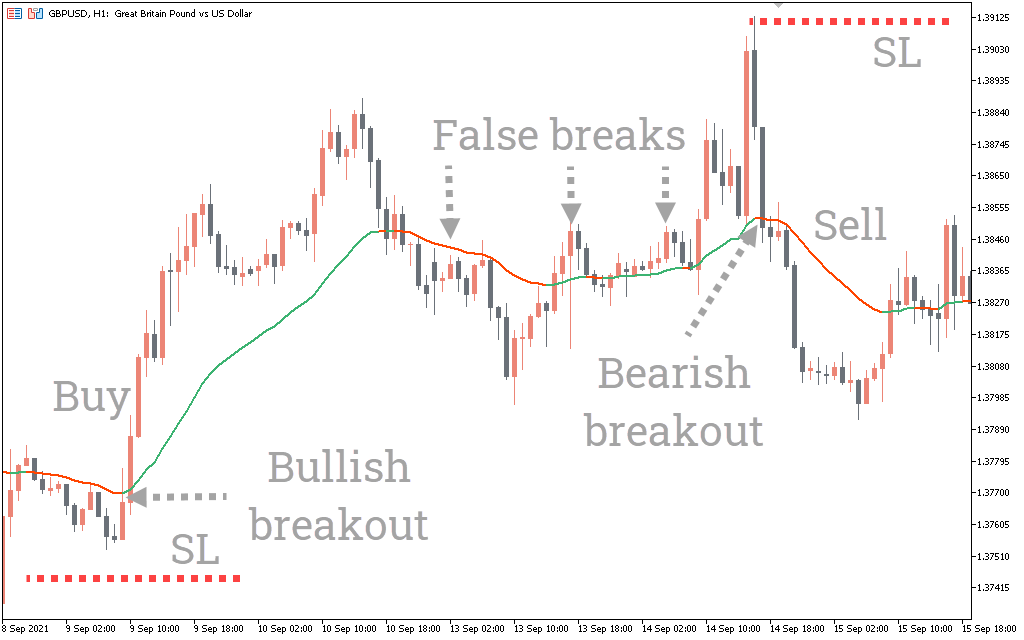
Studying the state of the trend and determining trading signals depends entirely on how the price reacts to the slope of the indicator.
The price primarily intends to bounce off the dynamic 0 to join the current trend move during a trending market. In the example above, the GBP/USD initiated a strong upward movement immediately after the bullish breakout applied at the level of the indicator. Later, when the market price returned to the slope again. It formed a false breakout, rejected the dynamic support zone and bounced back to continue the current bullish trend.
However, a breakout entry every time the price breaks the dynamic McGinley level may not work in the long run. The price can often form a false breakout at the support/resistance line as shown in the chart above.
Thus, it is necessary to first confirm the price breakout of the trendline before triggering a buy/sell order. In this case, we can wait a bit to secure a price breakout and get a trend reversal signal. For example, a bullish candlestick breaks above the Mcginley Dynamic Average, which is indeed a bullish breakout. But for further confirmation, you can wait until the high of the corresponding bullish bar is broken by the next price candles.
Conclusion
The Mcginley Dynamic Average indicator offers impressive support for Forex and stock day traders. Moreover, with the correct modification of the MT5 settings, you can use it for intraday trading as well. However, like any trading indicator, the Mcginley Dynamic Average requires a decent trading plan that will protect you from weak or false trading signals. It uses only one trendline to indicate dynamic support/resistance position including trend signals. Beginners may find this tool extremely useful when solving real trading problems.
1 2 3 4 5