
Market Structure Volume Distribution Indicator
MT4Market Structure Volume Distribution Indicator by LuxAlgo reveals buy and sell volume distribution across price levels to identify key liquidity zones.
Description
The Market Structure Volume Distribution Indicator is one of the most robust trading tools which shows very direct and informative information of the extent and distribution of trading volume over different price levels. Rather than only visualizing the total volume per candle, it captures where buying and selling activity becomes concentrated within the existing market structure.
This indicator was developed by the LuxAlgo team and has its focus on price structure and volume flow relationships. It also creates a profile that identifies points (or areas) where buyers and sellers have been active—this helps traders identify potential support, resistance, and liquidity levels.
Professional traders commonly use volume distribution analytics to identify where trades from players are taking place, and in which areas the top participants are moving in and out of trades. There are several of what have been described as large volume clusters, which can appear at any price band and are often important reaction spots in the price of future moves.
The LuxAlgo Market Structure Volume Distribution Indicator automates this process and builds an internal structured volume profile to display on the chart automatically.
Market Structure Volume Distribution Indicator Trading Signals
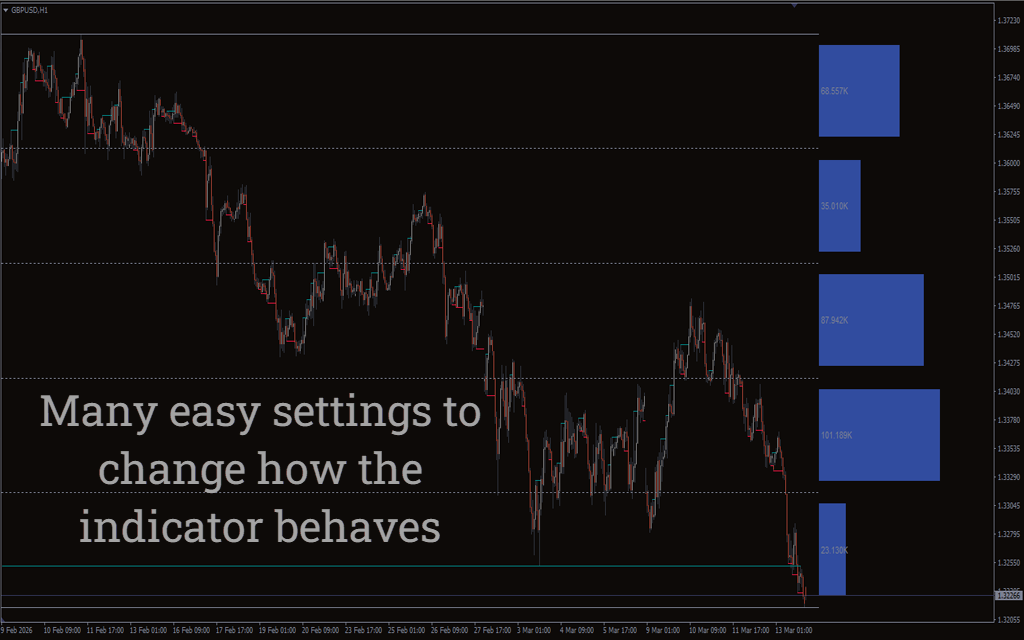
The indicator evaluates recent market structure and computes how trading volume is distributed within that structure. Rather than accounting for time-based volume, it shows how much buying and selling activity occurred at specific price levels.
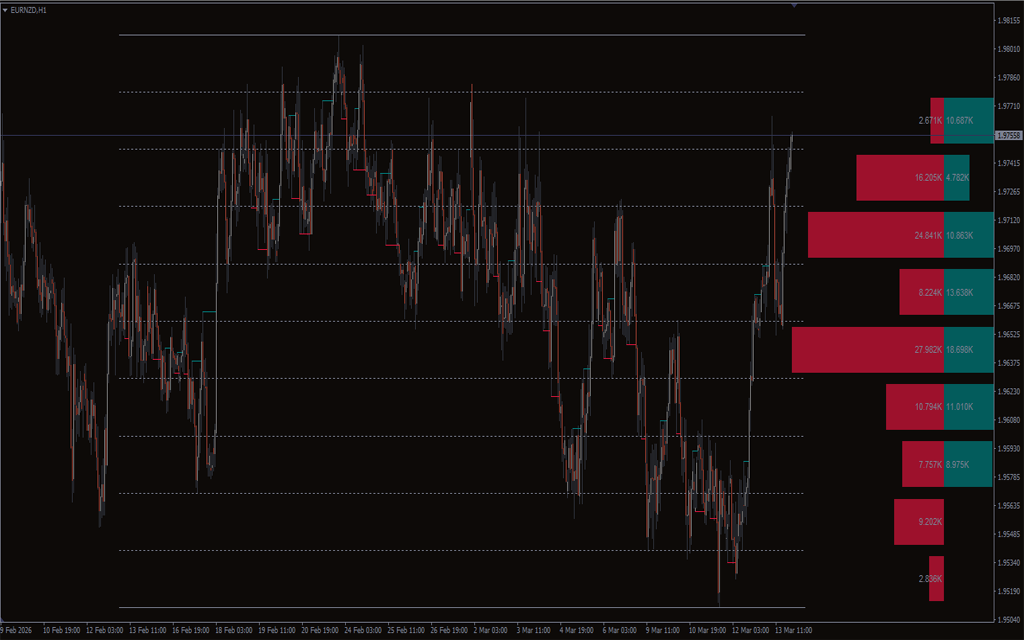
The output is a horizontal volume profile shown next to the price chart. Red segments typically represent selling pressure, while green or teal areas reflect buying volume. By monitoring the balance between these two components, traders can quickly see which side of the market was dominant at each level.
An unusually strong concentration of volume tends to be a key liquidity zone when a price level shows outsized volume concentration, and these zones frequently act as support or resistance areas because they represent locations where a large number of orders were previously executed.
For instance, if there is a clear cluster of buying volume at a certain level, the market may react when price returns to that region later. Buyers who placed positions there in the past might defend the level again, generating a support reaction.
On the other hand, heavy selling volume reflects potential resistance zones. When prices come back to these areas again, sellers can intervene, stopping the market from moving higher.
In addition, the indicator has the advantage of linking volume analysis with pivot-based market structure detection. The indicator highlights structural turning points in order to examine volume distribution within meaningful price swings rather than random parts of the chart.
Conclusion
The Market Structure Volume Distribution Indicator enables traders to more easily appreciate how volume relates to the structure of the market. It helps target the liquidity zones — where buying and selling are most concentrated — and they often influence the price the market reacts to later.
Created by LuxAlgo, this tool combines structural analysis with volume profiling to provide traders with deeper insight into real trading activity. It does not just illustrate price movement; it reveals where genuine trading activity is happening on the chart.
When combined with price action, support and resistance analysis, or trend confirmation tools, the Market Structure Volume Distribution Indicator can certainly be added to a professional trading workflow.

1 2 3 4 5