
MACD Divergence Indicator
MT5Also Available for MT4The MACD Divergence Indicator for MT5 helps traders detect any divergences between the price and the MACD indicator.
Description
Divergence in the Forex market is the best tool for determining the upcoming continuation or reversal of a trend. Divergence occurs when the oscillator and price move in different ways. The best oscillator for determining divergence is the MACD Divergence indicator.
Base
MACD Divergence Indicator for MT5 helps traders to detect any deviation between price and MACD. This indicator contains a volume histogram, as well as 12 EMA and 25 EMA.
The MACD volume histogram shows the strength and direction of the trend. Therefore, the 12 and 25 day EMA of MACD are used to determine trend reversal.
The MACD Divergence Indicator for MT5 can detect both regular and hidden divergences. Experienced traders use this indicator to open less risky and more profitable trades. This indicator is also the best tool for early recognition of a trend reversal or continuation.
How to detect divergence using the MACD Divergence indicator
Divergence is usually divided into two parts: ordinary and hidden. Regular divergence indicates a trend reversal, while hidden divergence signals a continuation of the trend.
Bullish regular divergence creates a higher low in the MACD while price makes lower lows. In contrast, a bearish regular divergence creates a lower MACD high while price makes a higher high.
The bullish hidden divergence creates a lower MACD low as price makes a higher low. Finally, a bearish hidden divergence creates a higher MACD high while price makes a lower high.
How to use the MACD Divergence Indicator to place trades
Bullish regular divergence indicates the end of a downtrend and the beginning of an uptrend. Thus, a bullish regular divergence is a buy signal.
Bearish regular divergence indicates the start of an uptrend after the end of a downtrend. Thus, a bearish regular divergence is a sell signal.
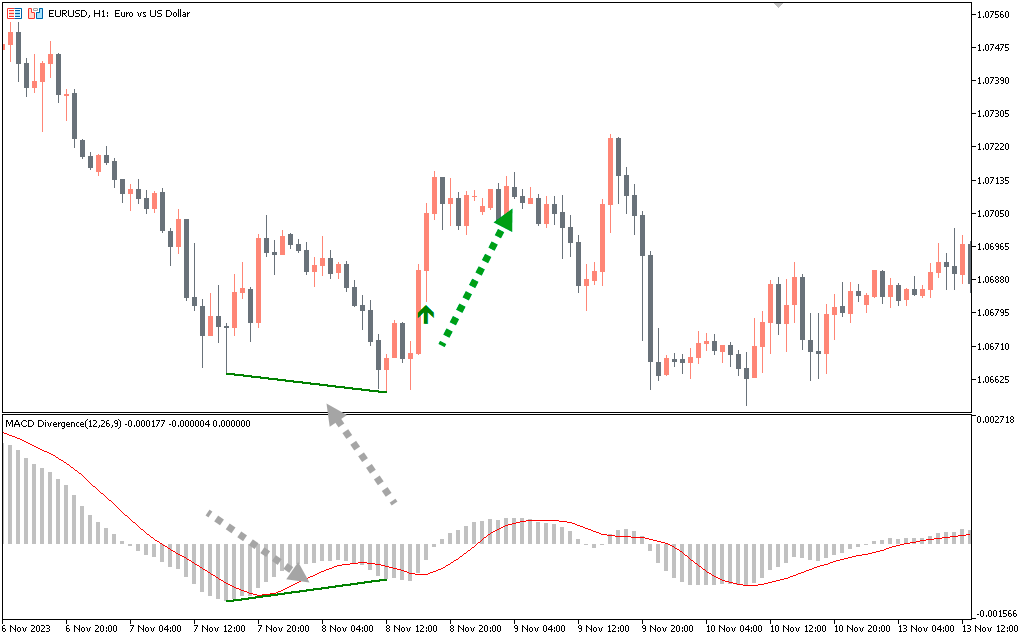
In addition, hidden bearish divergence means a continuation of the uptrend and is a signal to open a long position. The EUR/USD H4 chart below shows how to enter and exit trades using this indicator.
A bullish hidden divergence formed between the price and the indicator during the period from March 1 to March 9, 2021. This divergence was indicated by the red trend lines on the chart and indicator. Thus, the MACD divergence indicator signaled the inevitability of an uptrend. Also on March 9, 2021, a bullish engulfing candle formed.
The buy trade was confirmed when the fast 12 EMA crossed the slow 25 EMA upward. To manage risk, a stop loss was set slightly below the recent swing low (1.1823). The buy trade was closed when the fast 12 EMA crossed below the slow 25 EMA. Also, another bearish divergence formed on the chart from March 4 to March 12, 2021. This divergence is indicated by green trend lines on the chart and indicator. Thus, the indicator signaled the inevitability of a downward trend.
Additionally, a doji formed on March 12, 2021, meaning the bulls are exhausted. The sell position was confirmed when the fast 12 EMA crossed the slow 25 EMA downwards. To manage shorting risk, SL was set slightly above the recent swing high (1.2001). Partial profit can be taken around 1.1823. The trade was closed around 1.1707 (when the fast 12 EMA crossed the slow 25 EMA down).
Conclusion
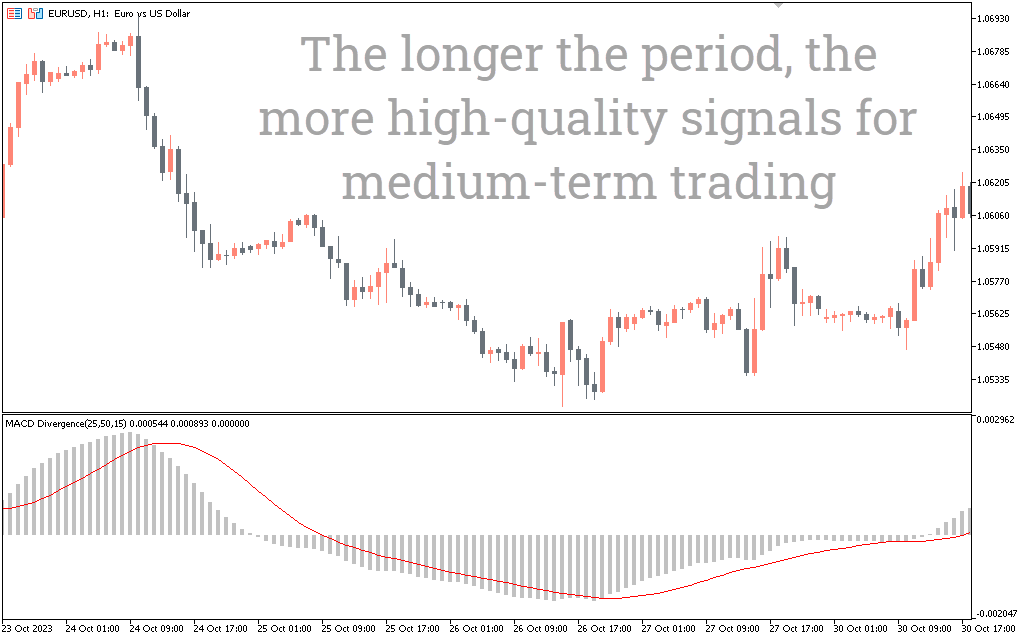
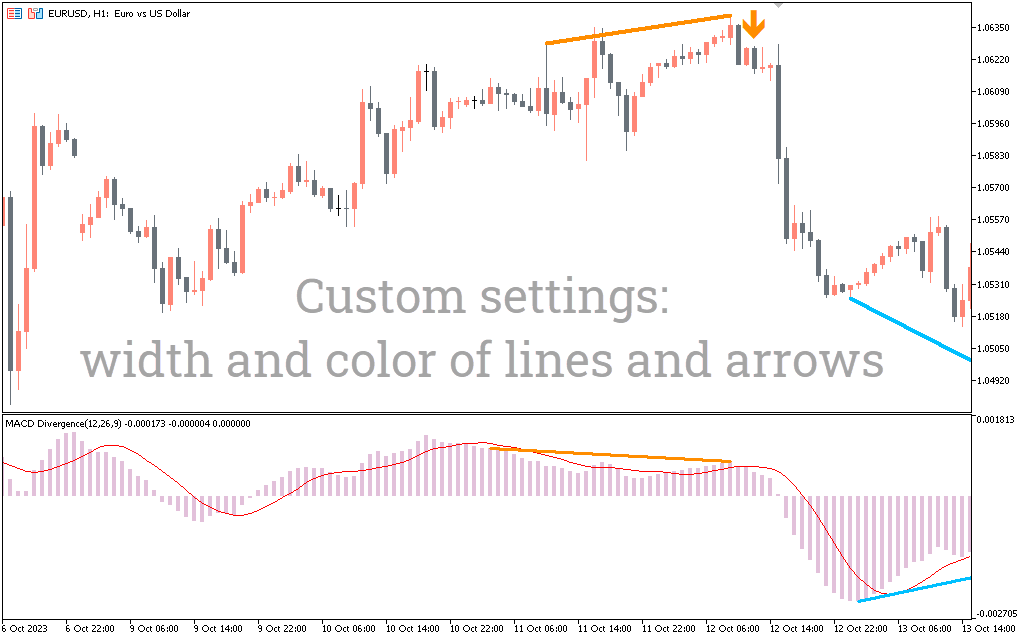
The MACD Divergence Indicator for MT5 helps forex traders detect divergences between price and MACD. This indicator can be used alone or in combination with other price action. For best results, traders should use this indicator on H1, H4 and daily time frames.
1 2 3 4 5