
MA Multi Timeframe indicator
MT5Also Available for MT4The MA Multi Timeframe indicator is a technical analysis tool that helps determine the strength of a trend. With this indicator you can catch the trend at a glance.
Description
The moving average is a classic statistical tool that many technical analysts use when analyzing forex and stock prices. This is considered the most popular indicator among Forex traders. However, it is difficult for traders to monitor multiple time frames at the same time. Traders who like to perform multiple timeframe analysis may have to switch between different timeframes, which can be time-consuming and energy-consuming. Thus, MA Multi Timeframe Indicator solves this problem and helps you find all moving averages, periods and directions in one window.
How does the MA Multi Timeframe indicator work?
The MA Multi Timeframe indicator shows long-term and short-term trends at a glance. This will help you determine the strength of the trend. Take a look at the GBPUSD chart below:
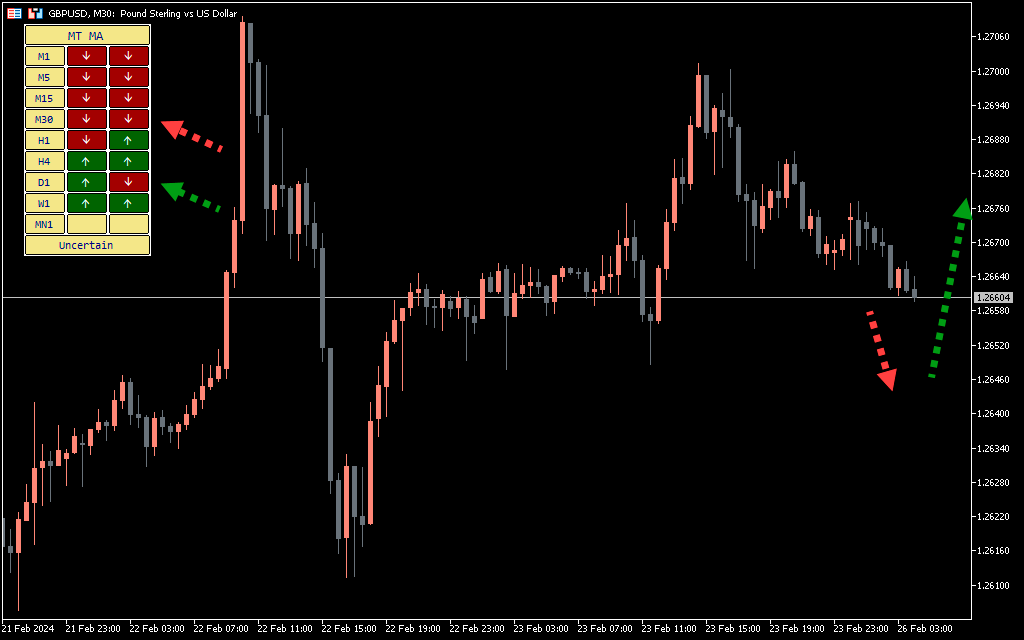
The indicator window shows that the price is above the 25-period moving average on all timeframes. The green arrow indicates the price above the moving average period, and the red arrow indicates the price below the moving average period. If the indicator shows all green arrows, it indicates a strong uptrend, and all red arrows indicate a strong downtrend. If the arrows are mixed, it means the price is consolidating.
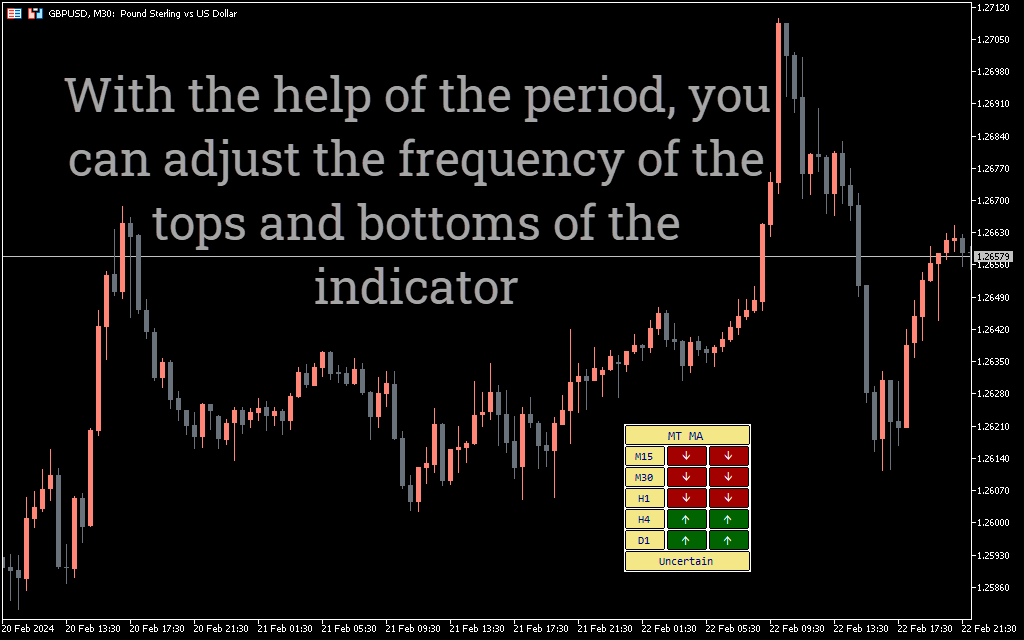
You can change the period in the settings. You can keep the period the same on timeframes or different for each, depending on your strategy.
Trading strategy using the multi-timeframe MA indicator
Now we will discuss a simple strategy based on the MA Multi Timeframe indicator.
Indicator buying strategy:
- Select period 20 for timeframes.
- If all the arrows are green, look for a buying opportunity.
- You can get confirmation from the candles. Wait for the bullish candle to complete its path on the 30-minute chart.
- Place a buy order at the market price.
- Place a stop loss near the low of the recent swing.
- Place take profit around the next horizontal level or round number on the chart.
Indicator selling strategy:
- Select period 20 for timeframes.
- If all the arrows are red, look for a selling opportunity.
- You can get confirmation from the candles. Wait for the bearish candle to complete its movement on the 30-minute chart.
- Place a sell order at the market price.
- Place a stop loss near the recent high.
- Place take profit around the next horizontal level or round number on the chart.
MA Multi Timeframe indicator conclusion
The MA Multi Timeframe indicator helps to determine the trend and its strength. This tool can save a lot of time and effort when manually switching time frames. However, the indicator cannot be used as an independent trading tool; Rather, you can combine it with any other tool or method to increase your chances of winning.
1 2 3 4 5