
Linear Regression Slope Indicator
MT4Also Available for MT5A Linear Regression Slope indicator shows the trend direction, strength, and momentum.
Description
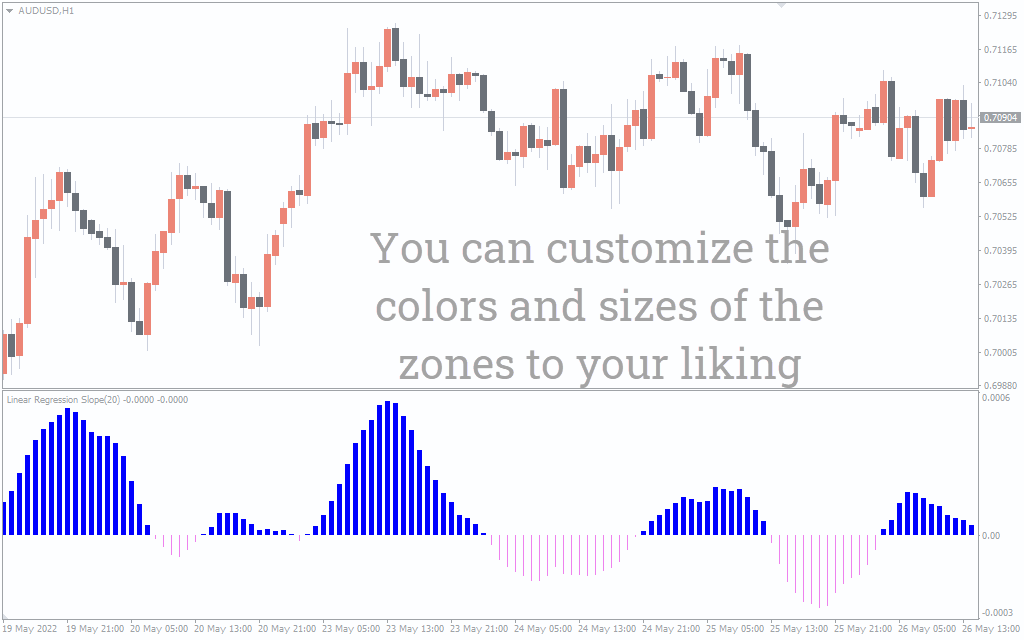
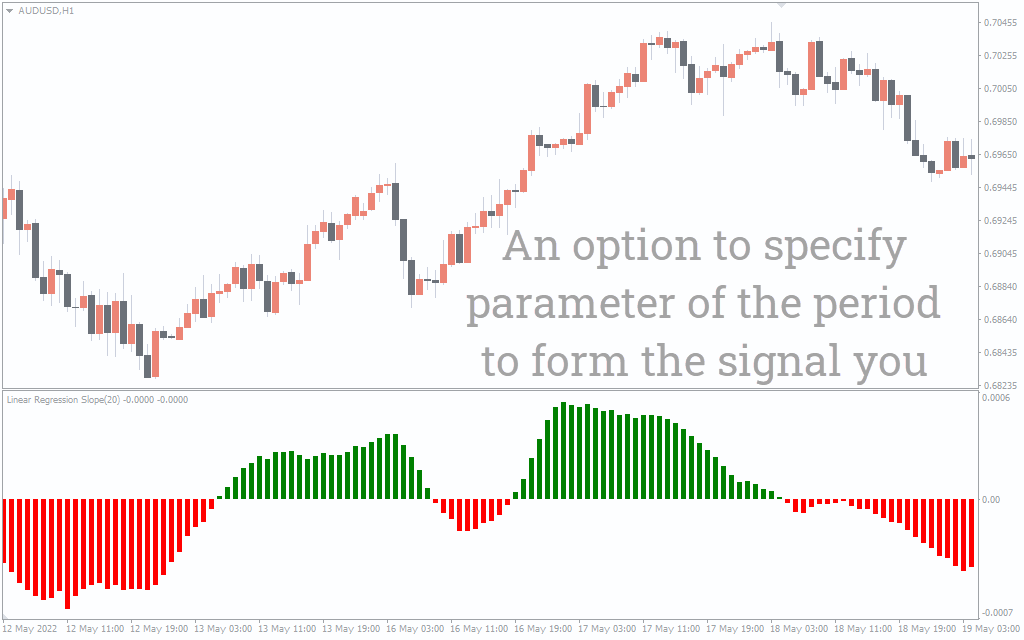
The Linear Regression Slope calculates the linear regression and then plots the slope. The indicator draws red and green histogram bars, which show the trend strength and momentum. This means that you benefit from signal generation and enables you to identify when the momentum is strong and when it is dwindling.
How To Use the Linear Regression Slope to Trade
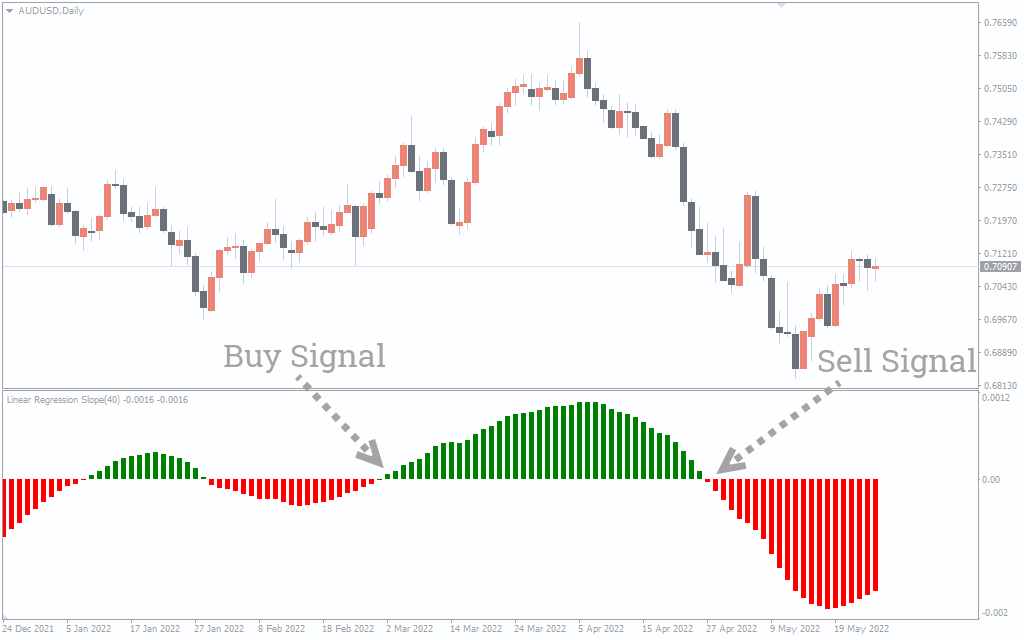
When the indicator crosses the zero line, the indicator gives a trade entry signal. When the bars elongate, that’s a tell-tale sign of increasing momentum. The histograms start to shorten when momentum dwindles. When the bar moves close to the zero line, which indicates a ranging market, it’s prudent that you should stay out.
Buy Signals
Buy when the indicator crosses above the zero line, and the histogram bars change to green. Exit when the indicator changes to red.
Sell Signal
Open a short position when the histogram bar changes color from green to red. Exit when it changes color back to green.
Linear Regression Slope Trading Example
The chart shows indicator MT4 on an AUD/USD price action. When the price is ranging, the indicator shows short bars.
The indicator posts green bars that lengthen during an uptrend as the momentum increases. Similarly, when the green bars change to red, the market is bearish. The bar’s length increases to indicate an increasing downtrend momentum.
Conclusion
The indicator is based on the linear regression line. The indicator plots a line slope, that provides buy and sell signals and shows the trend direction and momentum.

1 2 3 4 5