
KDJ Indicator
MT5Also Available for MT4Forex BUY and SELL signals from the best KDJ Indicator for MT5. Find the overbought and oversold conditions.
Description
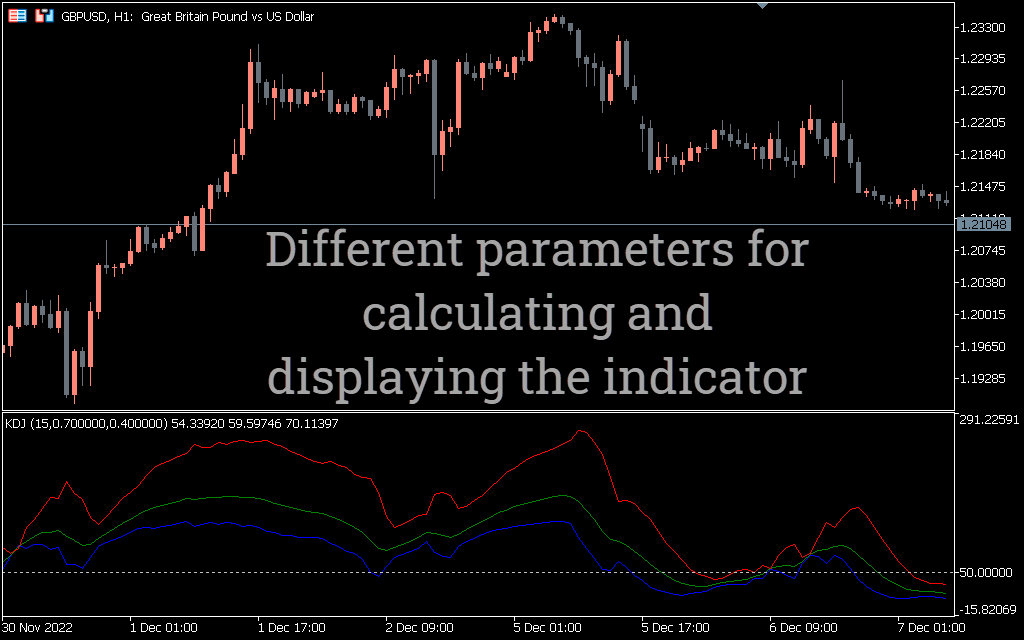
The KDJ indicator is a simple MT5 indicator that shows overbought and oversold levels. The indicator is a modernized version of the Stochastic Oscillator. The traditional stochastic oscillator has the K and D lines, while the KDJ adds an additional J line.
The indicator fluctuates between 0 and 100 and shows overbought and oversold levels. When the J line crosses the K and D lines, it is an overbought condition. Conversely, the indicator indicates an oversold zone when the J line passes below the K and D lines.
Traders can apply the indicator on any time frame; however, it is best to use it on longer timeframes to reduce market noise.
KDJ Indicator for MT5 BUY/SELL signals
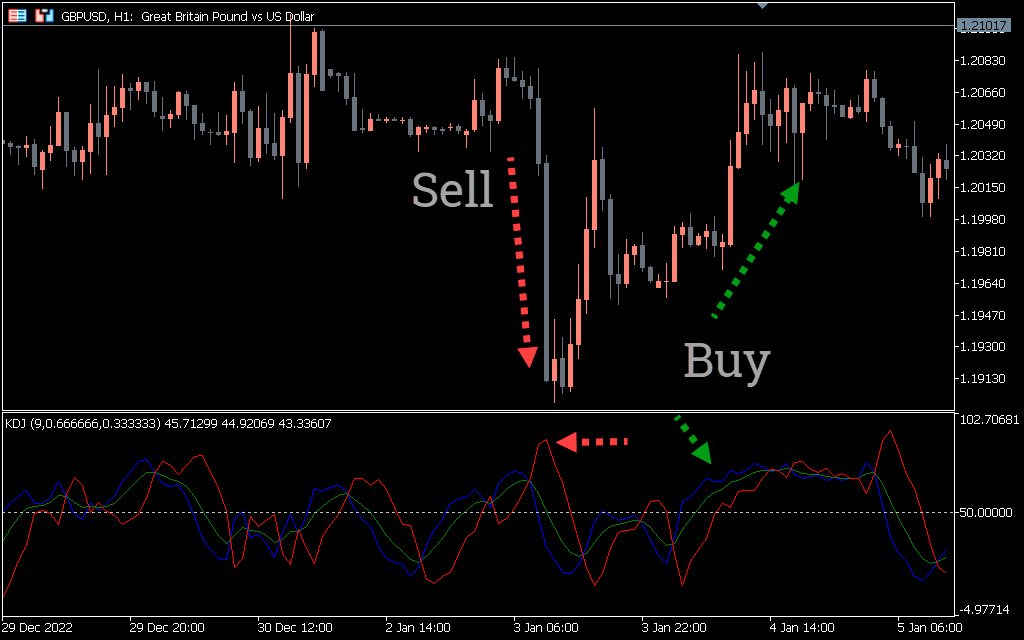
The above GBP/USD H1 chart shows the KDJ Indicator BUY and SELL signals.
To look for BUY and SELL signals, traders need to look at the J line. As mentioned above, when the J line crosses the blue and red lines, the indicator is in the overbought zone. Here traders can open short positions or close long positions.
On the other hand, when the J line crosses below the D and K lines, the indicator marks an oversold zone and traders can enter long or exit short positions. The indicator works best on its own, but traders can apply additional indicators with the KDJ indicator.
Conclusion
The KDJ indicator works as a stochastic oscillator with the addition of a J line and shows overbought and oversold zones. If you want to download it, you can download the indicator for free on our website.
1 2 3 4 5