
KAGI 1 Indicator
MT5Also Available for MT4Introducing simply the best MT5 trend following oscillator that accurately shows market trends on MTF charts. Ideal for forex and stock trading strategies.
Description
KAGI 1 for MT5 is an intriguing technical indicator that can help traders more accurately identify buy and sell entries and exits, especially in the Forex and Equity markets. Buying or selling assets based on the recent strength of market trends is known as momentum trading. It is based on the notion that if a price movement has enough momentum, it will continue to move in the same direction.
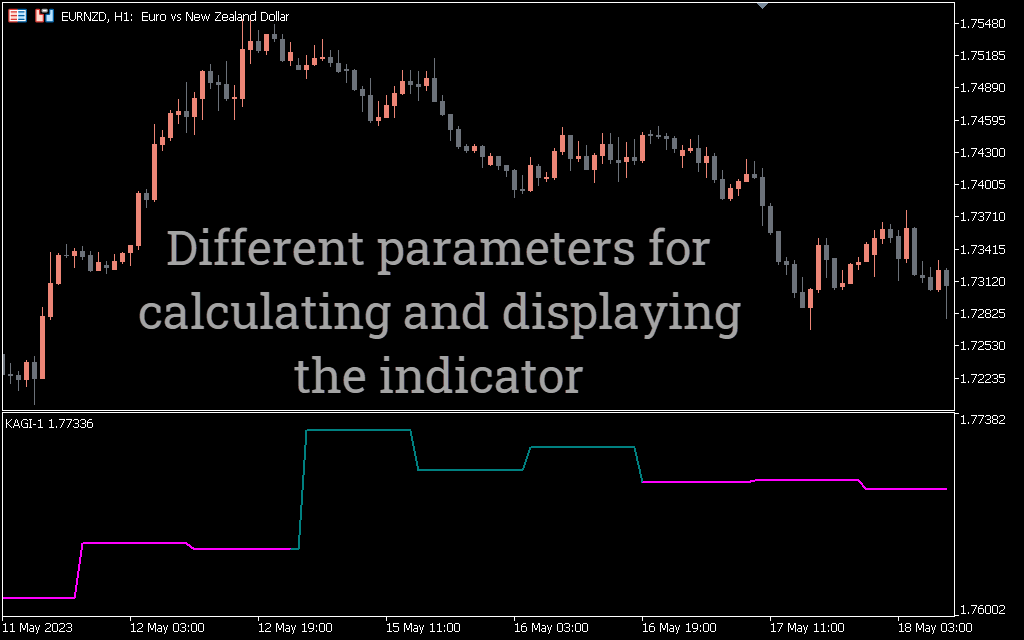
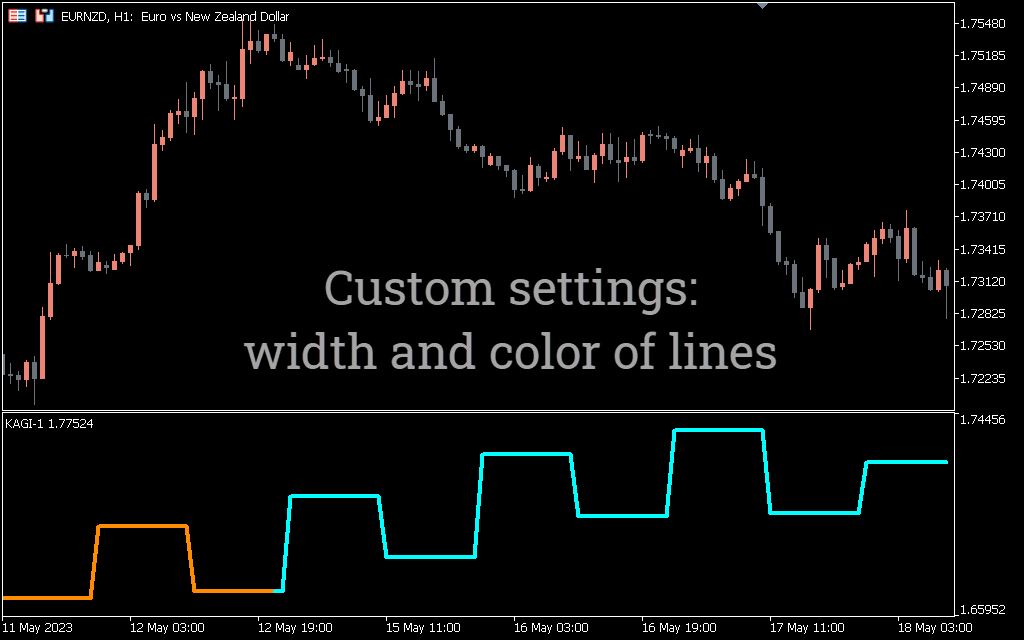
KAGI 1 takes into account recent price movements more, which allows it to immediately respond to possible changes in market trends. Its signal line uses light and thick blue colors to show if it is bullish or bearish, taking control of the current momentum.
In addition, KAGI 1 is an MTF indicator and allows you to simultaneously look for opportunities for short-term and long-term trading, including scalping, day and intraday trading. This guide explains how to trade with the correct market trend using the KAGI 1 MT5 indicator.
How to Anticipate Buy-Sell Signals Using the KAGI 1 Indicator in MT5
If you can track the moment when the KAGI 1 level changes its color, you can predict future changes in market bias. A thick blue line indicates a bullish trend, while a light blue line indicates a bearish one.
Interestingly, the slope of the indicator moves in the opposite direction to show the strength and weakness of the trend. This means that the value of the indicator decreases during a bull market. Conversely, the value continues to rise when the price continues to move in a bearish direction.
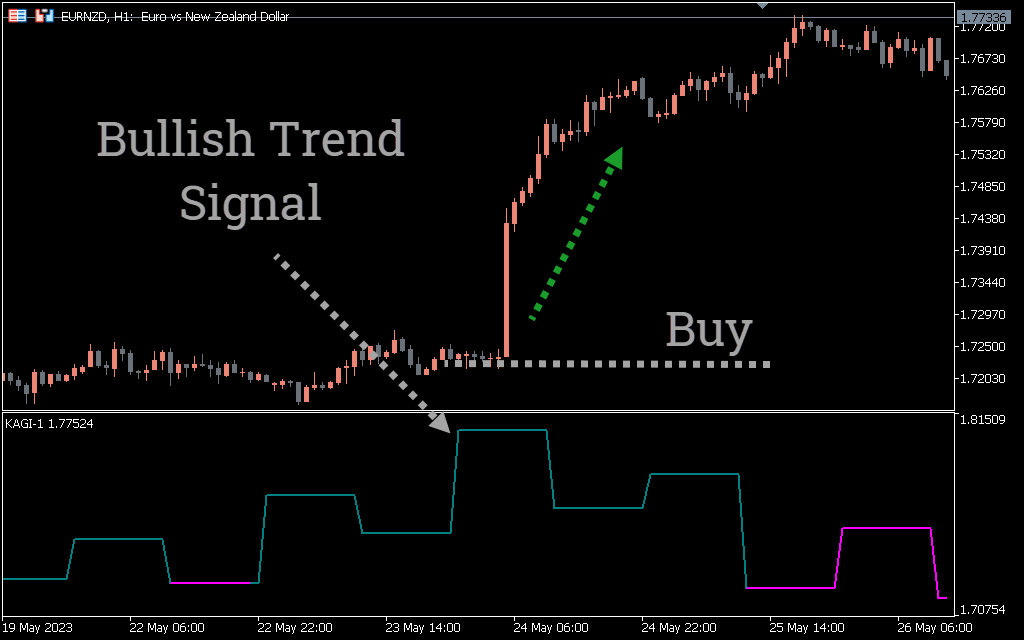
The GBP/USD H4 chart above is an example of a buy signal that we identified using the KAGI 1 indicator. Initially, the price moved up as it moved above the bullish trend line. During the bull run, the price bounced back for a correction to retest the support line. Later, the price rejected the trendline support and started another bullish move. Meanwhile, the slope of the KAGI 1 indicator turned solid blue, confirming a buy signal after the overall bullish trend.
Before opening a short position, the indicator should draw a blue line to make sure the market is in a strong downtrend. Then look for a bearish candlestick pattern to validate the sell order.
Conclusion
The KAGI indicator is one of the easiest technical tools to identify potential entry and exit points on MT5 charts. The indicator works by plotting two lines on the chart, one for support and one for resistance. Carefully observing the color change of the indicator slope can help you spot the generated potential trade signal. The KAGI 1 indicator also helps traders identify trend reversals, which can be used as an additional signal to enter and exit trades. This indicator is easy to use and can be an effective tool for traders looking to maximize their profits in the currency and stock markets.
1 2 3 4 5