
Gann Levels Indicator
MT4Explore the Gann Levels Indicator for MT4, a reliable tool to identify key price levels for better decision-making. Learn how it highlights support, resistance, and trend reversals.
Description
The Gann Levels Indicator for MT4 is a powerful tool designed for traders aiming to leverage W.D. Gann’s methodologies. This indicator visually plots crucial price levels on the chart, serving as a guide to support, resistance, and potential trend reversals. By implementing Gann’s geometric and mathematical principles, this indicator provides clarity to complex price actions, helping traders make well-informed decisions. With its simplicity and effectiveness, the indicator is suitable for beginners and experienced traders alike, offering a clear structure to navigate even the most volatile markets.
If you’re exploring the world of Gann-based tools, I highly recommend checking out our other advanced indicators such as the Gann SQ9 (Square of 9) Indicator and the Gann Made Easy Indicator. Both of these complement the Gann Levels Indicator exceptionally well by adding extra visual guidance and precision geometry to your trading analysis.
When I first installed the Gann Levels Indicator, I was surprised by how plug-and-play it was. After attaching it to the chart, the levels were automatically calculated and plotted without any manual input. I’ve tested it across several currency pairs and timeframes, especially on H4 and daily, and the plotted zones were impressively accurate in anticipating support/resistance reactions. One thing I appreciated as a trader was how little tweaking was needed in the settings. I adjusted the number of levels slightly to match my swing trading style, and it worked smoothly right out of the box.
Gann Levels Indicator Trading Signals
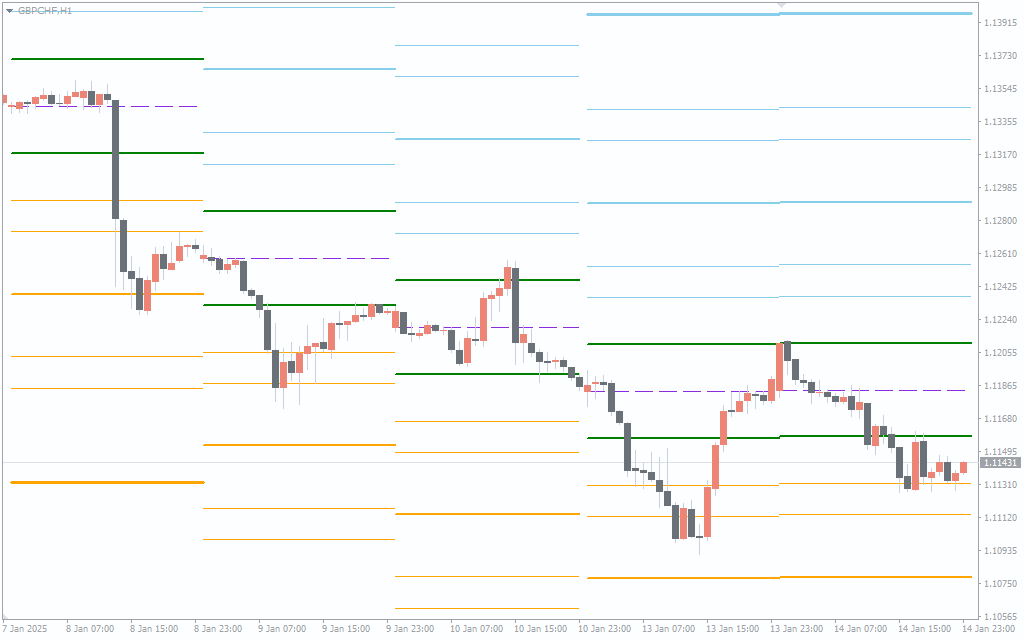
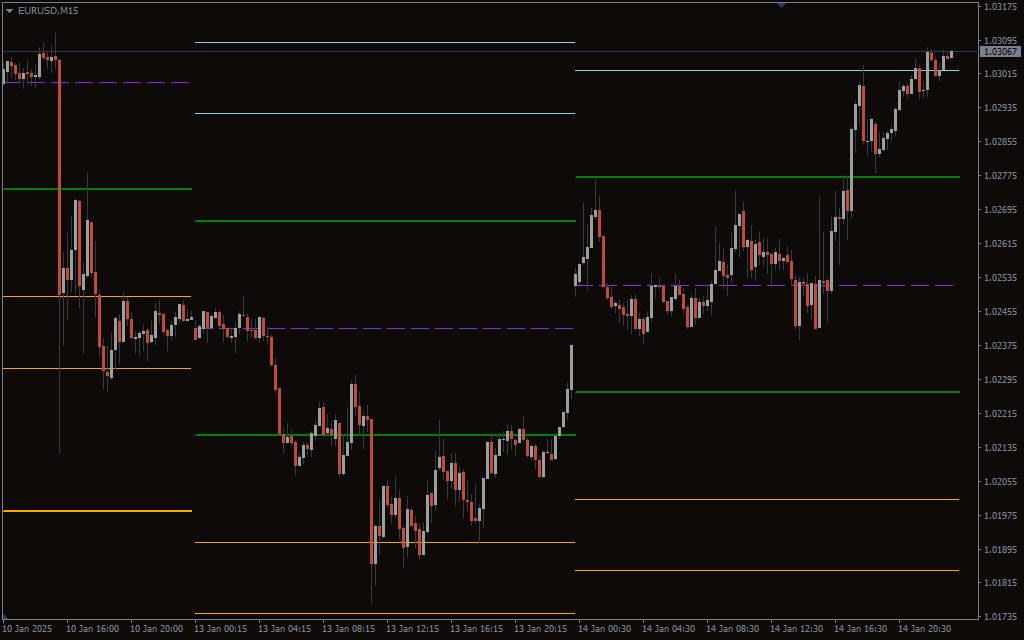
The Gann Levels Indicator helps traders predict price movements by mapping important horizontal price levels on the chart. These levels act as support and resistance zones, assisting in determining possible entry and exit points. As the price interacts with these lines, traders can gauge the strength or weakness of the current trend. A break above a level may signify upward momentum, while a fall below may indicate bearish sentiment. The indicator’s precision in identifying these levels enables traders to make confident decisions in real-time.
Pros and Cons of the Gann Levels Indicator
 Pros
Pros
- Automatically calculates key levels based on Gann’s formulas.
- Highly visual and easy to interpret, even for beginners.
- Works well on all timeframes, especially effective on H4 and D1.
- Low-configuration setup—ready to use straight out of the box.
- Can be used in confluence with trendlines, price action, or Fibonacci.
 Cons
Cons
- Not designed to generate direct buy/sell signals—should be used as a guide.
- May require additional confirmation indicators in highly volatile conditions.
- Traders unfamiliar with Gann theory might need a short learning curve to fully utilize its potential.
Conclusion
The Gann Levels Indicator is an exceptional addition to any trader’s toolkit, simplifying complex price movements and providing actionable insights. Whether you’re looking to define support and resistance zones or identify potential trend reversals, this indicator is an excellent resource. Its user-friendly design and robust functionality ensure that traders of all experience levels can incorporate it seamlessly into their strategies. Download the Gann Levels Indicator today to enhance your technical analysis and trading outcomes.
Frequently Asked Questions (FAQ)
 Does the Gann Levels Indicator repaint?
No, the levels generated by the Gann Levels Indicator remain fixed once plotted. They are calculated based on the initial price anchor and do not repaint on subsequent candles.
 What’s the best timeframe to use this indicator?
While the Gann Levels Indicator can be used on any timeframe, I’ve personally seen the most consistent results on H1, H4, and D1 charts.
 Can I use this with automated trading systems?
While the indicator is primarily visual, some expert advisors (EAs) can be configured to recognize the plotted levels. However, manual confirmation is generally advised.
 How is this different from standard support/resistance indicators?
Unlike simple horizontal line tools, the Gann Levels Indicator is based on W.D. Gann’s time-tested geometric and cyclical price theories. It doesn’t just plot obvious highs and lows but calculates strategic price levels that often align with market turning points.

1 2 3 4 5