
Flat Trend Indicator
MT5Also Available for MT4Suitable Flat Trend indicator for an accurate buy and sell signal. It is an ultimate trend reversal detector.
Description
What is a flat trend indicator for MT5? The free Flat Trend indicator is a confluence of three moving averages. The indicator combines fast, medium and slow moving averages to create an indicator that is displayed in a separate window below the price chart for ease of reading and interpretation.
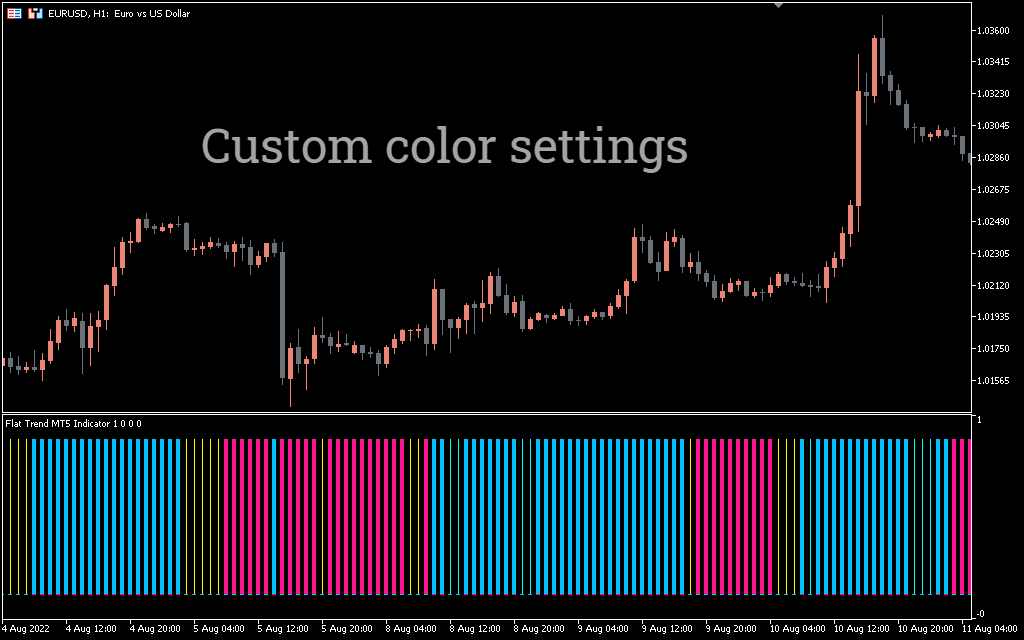
The indicator changes color from red to blue to thin bars depending on the prevailing market trend. You can change the moving average settings according to your trading strategy. You can use the flat trend as a standalone indicator or in combination with other technical trading tools.
The indicator works well in any market. For example, you can use it to scalp low spread currencies such as EUR/USD and GBP/USD.
How to trade with the flat trend indicator
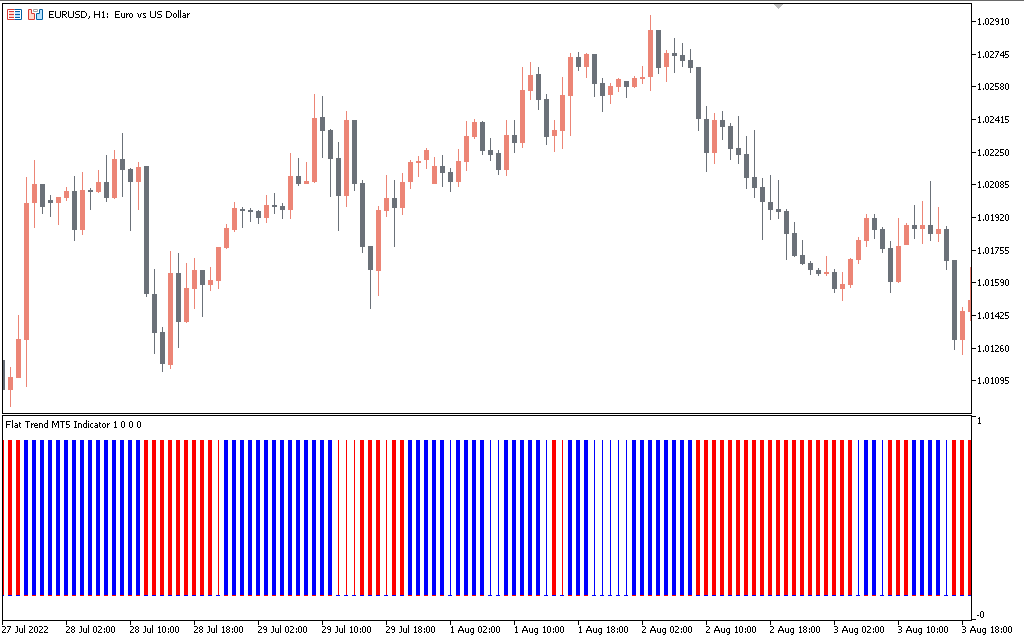
The indicator strips can be of three colors.
- Blue bars represent a buy signal.
- Red bars indicate a sell signal.
- Thin blue and red bars indicate a stable market trend.
Buy Signal
Wait for the indicator to show thin bars. This indicates market consolidation. Now enter a buy position when the indicator changes from thin to blue. In fact, a buy signal occurs when the indicator bars change color to blue.
Sell signal
The Flat Trend indicator shows an ideal short position when the indicator color changes to red. You can wait for the tool to establish a market range by placing thin bars.
You can also use price action to get a clear signal. For example, if price action indicates a market in a range, enter a trade when the indicator turns red. For an impending uptrend, wait until the indicator turns blue.
Exit strategy
Exit a long position when the indicator changes color from blue to thin and then to red or from blue to red. This is a sign of a market reversal. Similarly, exit a short position when the indicator bars change color from red to blue.
Sample chart
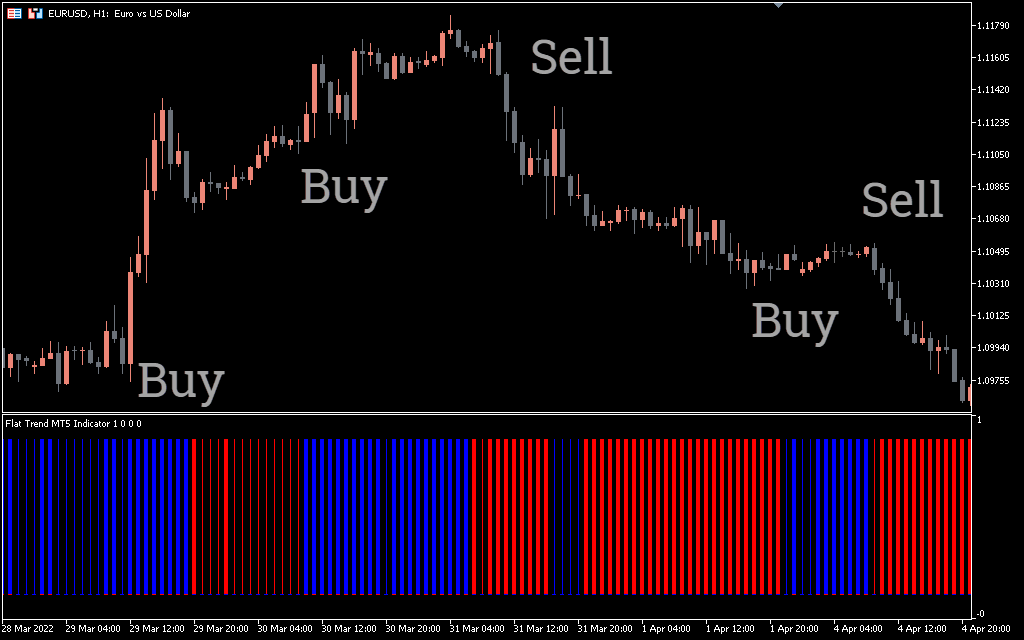
The price chart shows the price movement of the euro against the pound sterling. The indicator bar changes color to blue, signaling a buy signal as shown in the chart. In fact, after a buy signal, the market moves more than a hundred points up.
Similarly, the indicator changes to red, which is a sell signal. Thin bars indicate a market range. The price moves more than 50 pips after the sell signal shown on the chart.
Conclusion
The flat trend indicator is suitable for all types of traders. If you want to determine price direction or get buy and sell signals, this is the right tool for you. You just need to get familiar with the color changes. Just buy when the indicator bars are blue and go short when the indicator bars are red. If the bars are thin, it is prudent to stay away from the market and wait for it to start trending.
1 2 3 4 5