
EMA Trend Indicator
MT4Also Available for MT5Forex market trend from the best EMA Trend Indicator for MT4. Find the trend’s strength with the help of multiple EMAs.
Description
The EMA Trend Indicator uses two EMAs to signal the direction of the trend. The indicator applies a fast and a slow EMA; you can enter the trade whenever the crossover between the two happens.
The indicator plots two slow EMAs and two fast EMAs; however, it calculates one fast and one slow EMA.
The good thing is EMA Trend Indicator works on all timeframes. However, to avoid any false signals, applying the indicator on longer timeframes is better.
How to use the EMA Trend Indicator for MT4?
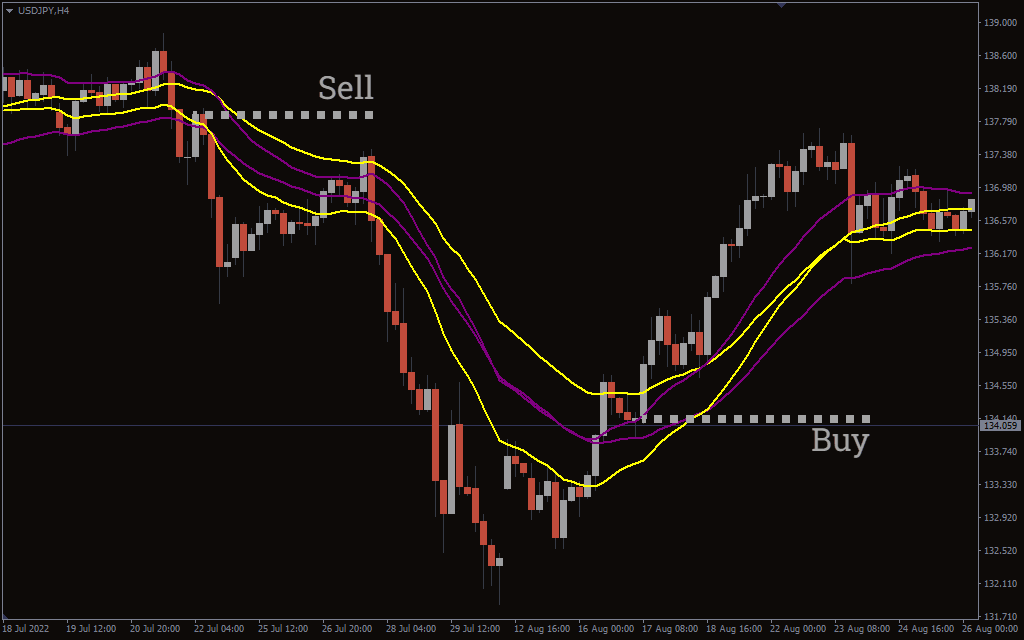
The above USD/JPY H4 chart shows the EMA Trend Indicator BUY/SELL signals.
To find out the BUY/SELL signals, you have to look at the EMAs crossovers. When the fast EMA (purple) crosses above the slow EMA (yellow), it signifies a bullish momentum, and you can go long.
On the other hand, when the slow EMA (yellow) crosses above the fast one (purple), it’s a sign of bearish momentum, and you can go short.
It’s important to remember that, like the traditional Moving Averages, the EMA Trend Indicator applies calculations on the previous data, so it’s best to combine the indicator with other indicators for further signal confirmation.
Conclusion
The EMA Trend Indicator for MT4 applies the EMAs on the chart and signals the trend’s direction with their crossovers. The crossovers can help in determining clear entry and exit points.
You can download the EMA Trend Indicator for free here.

1 2 3 4 5