
AMA Smoothed RSI indicator
MT5Also Available for MT4Forex BUY SELL signals from the best MT5. AMA Smoothed RSI indicator. Direction detector. Accurate trend indicator.
Description
The AMA Smoothed RSI indicator is an easy to use MT5 indicator that works like a traditional RSI. It plots a signal line similar to RSI, but with some changes.
The indicator tells you about overbought and oversold regions and presents buying and selling opportunities. In addition, it captures bullish and bearish divergences and identifies trends better than the traditional RSI indicator.
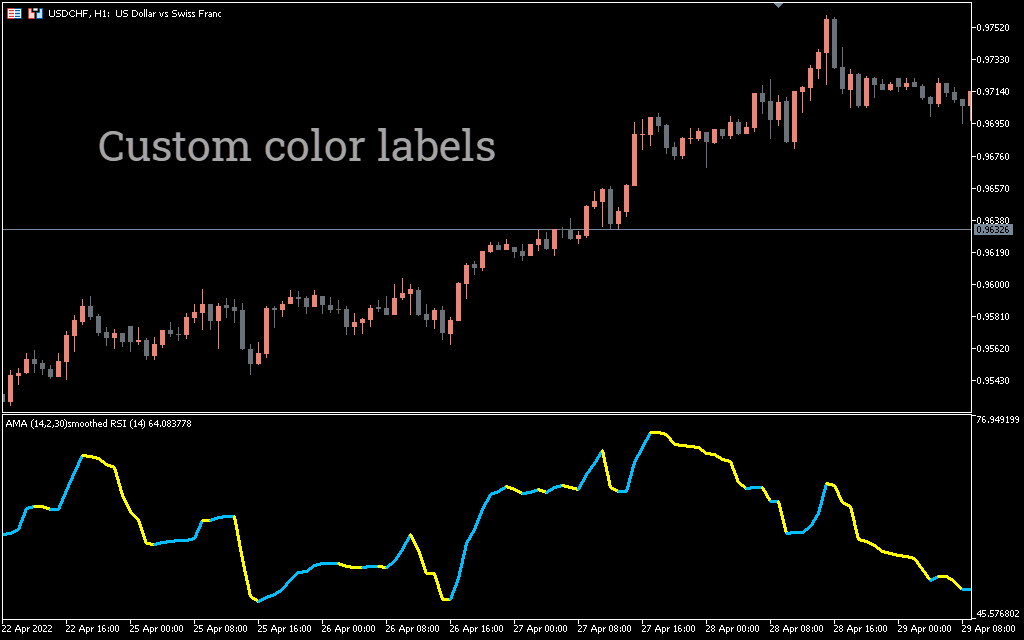
AMA Smoothed RSI consists of one line, which is the signal line. It works exactly like the traditional RSI and shows overbought and oversold levels.
When the indicator moves down, it means that the downtrend is ending and the uptrend is starting. Conversely, when the indicator forms an uptrend, it indicates the start of a downtrend.
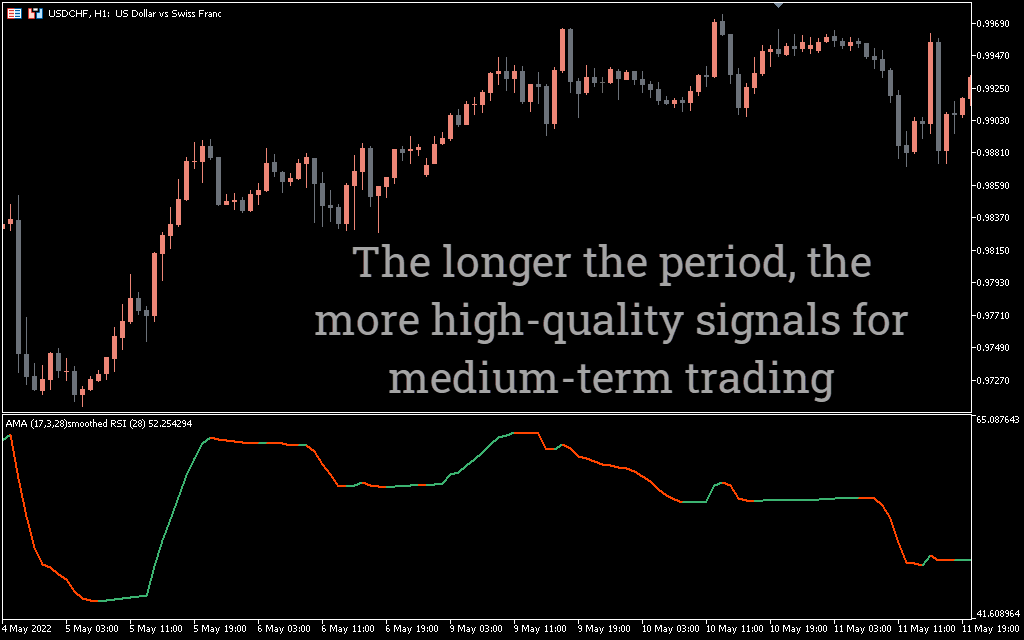
The indicator can be used on any timeframe. However, to avoid false signals, it is better to use this indicator on a longer timeframe.
AMA Smoothed RSI Indicator BUY/SELL signals
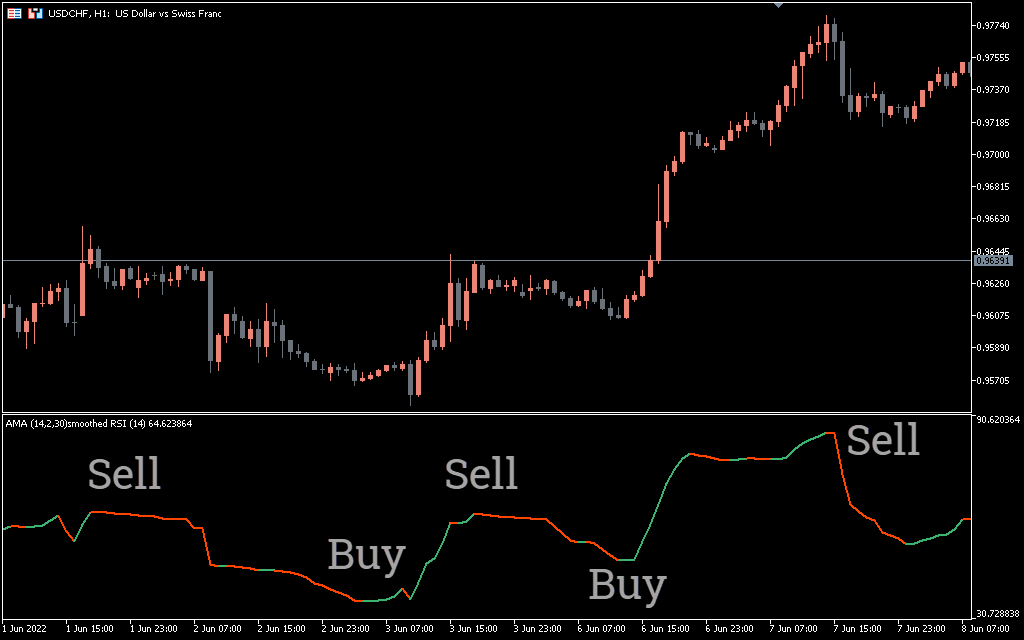
The USDCHF H1 chart above shows the BUY and SELL signals for the indicator. As you can see, the price moved up and down after the buy and sell signals.
As mentioned earlier, the AMA Smoothed RSI indicator for MT5 is a signal line that indicates the direction of the trend. To use the indicator, you need to remember the traditional RSI settings.
When the RSI is below 30, it is in oversold territory and represents a good buying opportunity, as you can see in the chart above. On the other hand, when the RSI is above 70, it is in the overbought zone and provides a good selling opportunity.
If the indicator is moving down, this means that the RSI is below 30 levels and you should open buy positions. On the other hand, if the indicator shows an upward movement, this is a sell signal and the RSI is above 70.
This indicator also indicates a trend reversal. Whenever the indicator makes an upward movement, it is in an overbought condition and the price will go down. On the other hand, when the indicator forms a downward line, it indicates an oversold condition and the price will go up.
How useful is the AMA Smoothed RSI indicator?
The indicator works like a traditional RSI with a signal line. It presents you with overbought and oversold areas, thus defining BUY and SELL signals.
Can I download the AMA Smoothed RSI indicator for free?
Yes, the AMA Smoothed RSI indicator is free to download.
Conclusion
The AMA Smoothed RSI indicator is a simple indicator that works exactly like the traditional RSI. The indicator gives you clear BUY and SELL signals.
In addition, the indicator identifies key reversals to represent the overall momentum of the market. In addition, the indicator is free to download, making it easily accessible to all forex traders.
1 2 3 4 5