
3d Oscillator Indicator
MT4Also Available for MT5Forex market trend from the best 3d Oscillator Indicator for MT4. Find the trend’s momentum.
Description
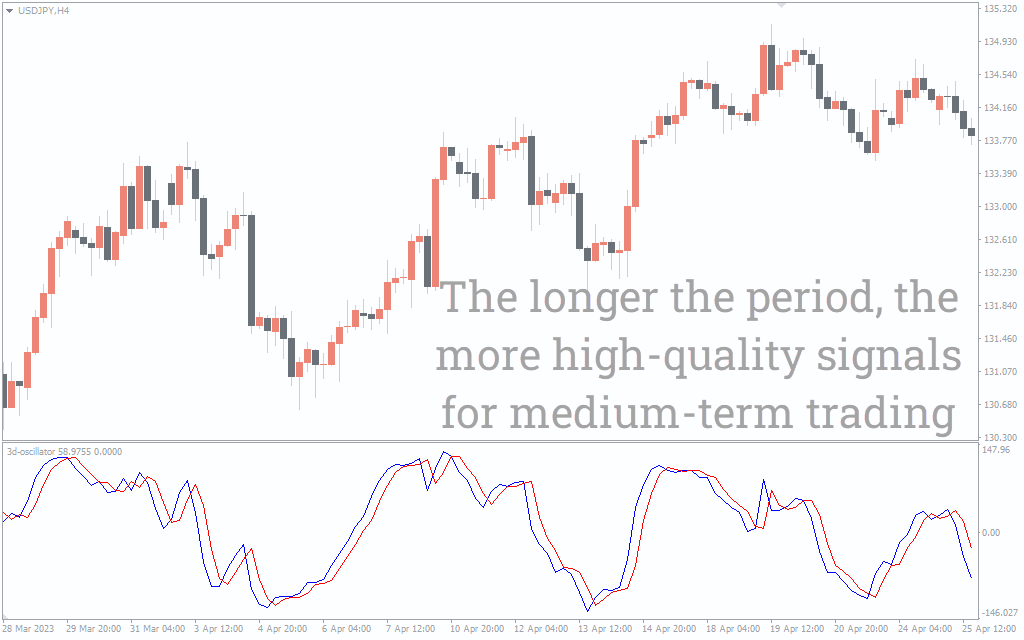
The 3d Oscillator Indicator is an upgraded version of the traditional Stochastic Oscillator. It comprises two lines: %K and %D. The %K line represents the current market position. In contrast, the %D line is a moving average of the %K line used to generate signals and identify potential entry or exit points.
The good thing is the indicator works on all timeframes like the traditional Stochastic. However, to avoid any false signals, applying the indicator on longer timeframes is better.
How To Use the 3d Oscillator Indicator for MT4?
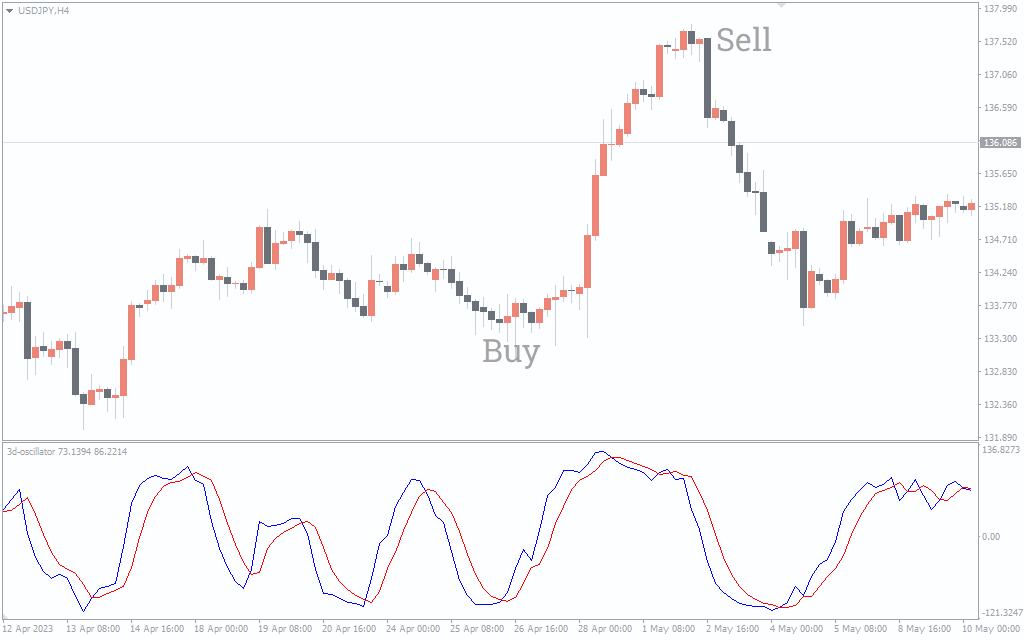
The above USD/JPY H4 chart shows the indicator’s BUY/SELL signals.
To find out the BUY/SELL signals, you have to look for the overbought and oversold levels.
When the oscillator rises above 80, it suggests that the asset may be overbought, and you can enter a short trade. Conversely, when it falls below 20, it suggests that the asset may be oversold, and you can go long.
You can also use the indicator to find divergences. For example, if the price is higher but the oscillator is lower, it suggests a bearish divergence and a potential trend reversal.
It’s important to note that the effectiveness of these signals may vary depending on the market conditions. So, it’s better to apply other indicators along with the 3d Oscillator Indicator for further signal confirmation.
Conclusion
The 3d Oscillator Indicator for MT4 applies the traditional Stochastics on the chart and locates the overbought and oversold levels. By finding these levels, you can enter or exit the trade.

1 2 3 4 5