
WeisWave Indicator
A super tool for harmonious trading with smart money. The WeisWave indicator refers to the law of supply and demand. This really works in Forex and other markets. No-repaint.
Description
The WeisWave indicator looks like a very simple free technical tool, but its purpose is to analyze complex market processes.
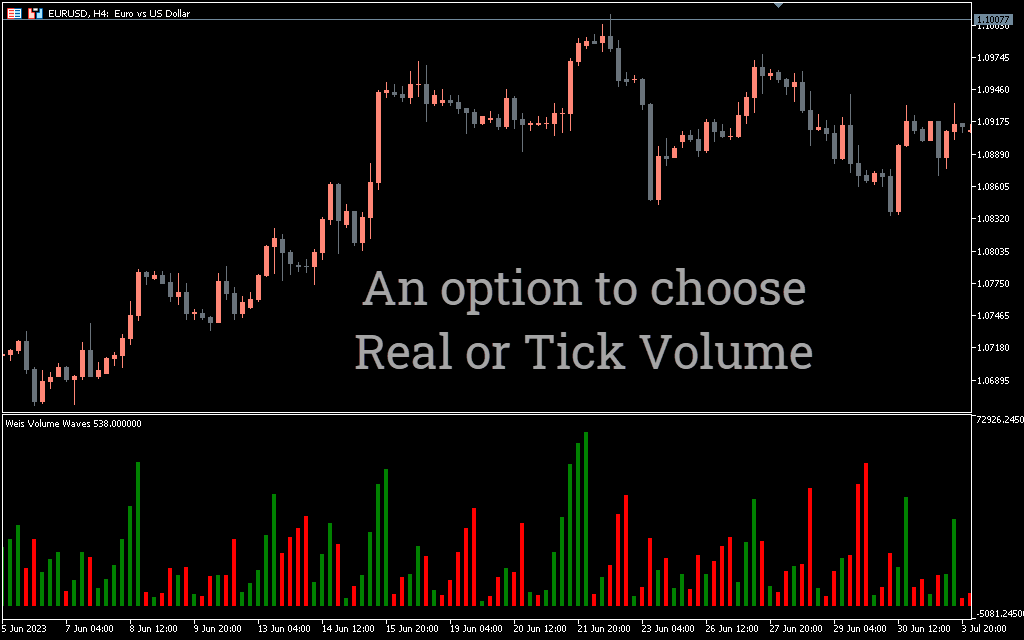
When you add the WeisWave indicator to your chart in Metatrader 5, you will see a two-color histogram below the price chart.
Here’s what the WeisWave indicator does:
- First, it breaks down the price chart into a sequence of bullish and bearish trends. Number 1 in the picture above shows a bullish price wave.
- The WeisWave indicator then summarizes all relevant values, which are displayed in the Volume panel (2).
- This way we get the total volume for each wave.
How to trade
The WeisWave indicator does not provide simple buy and sell signals using arrows, line crossings or other methods.
Think of volume as effort:
- Volume on bullish waves reflects the strength of buyers (demand).
- Volume on bearish waves reflects the strength of sellers (supply).
The WeisWave indicator helps you compare the amount of effort expended and the amount of progress achieved. To do this, you need to evaluate how:
- the wave lasted a long time;
- the price has changed a lot;
- what is the total volume of the wave (what exactly does the WeisWave indicator show).
We hope the examples below will help you better understand how to use the WeisWave indicator.
Example
The diagram below shows the use of the WeisWave indicator for intraday trading in the Forex market.
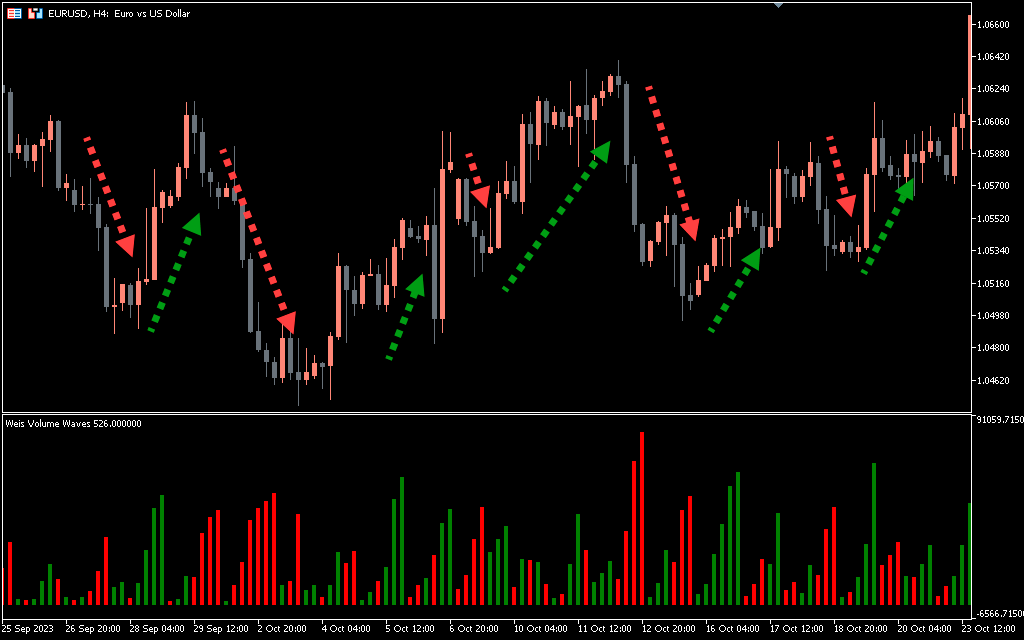
Figure 1 shows a bullish wave. Compared to previous waves it has:
- Significant progress in price growth.
- Significant duration over time.
- Large cumulative volume on the WeisWave indicator (shown in Figure 2).
Note that large cumulative volume values are obvious when looking at the WeisWave indicator, but are difficult to recognize when using a classic volume indicator.
The aggressive nature of the bullish wave (1) indicates the strength of the buyers, so you should wait for the next bearish wave to see if the sellers are weak.
Then, when the bar marked 3 shows the start of a new bullish wave, you have justification for entering a long position.
It is advisable to place a stop order below the previous local minimum. And to exit a position with a profit, we recommend using trailing tactics, moving the stop order upward as weak downward waves form.
Important! Make sure the R:R ratio is in your favor.
Conclusion
The WeisWave indicator for Metatrader 5 will help you trade in harmony with market makers. It does not repaint.
The indicator divides price data into a sequence of bullish and bearish waves and then calculates the cumulative volume for each wave.
Advantages of the WeisWave indicator:
- Allows you to analyze supply and demand.
- Works on all markets: Forex, stocks, commodities.
- Works on all timeframes: both for intraday traders and long-term investors.
- It can be combined with other tools: for example, with the classic RSI indicator and/or trend lines.
Disadvantages of the WeisWave indicator:
- The indicator does not generate automatic buy and sell signals.
- To correctly analyze an indicator, you need to spend many months on training. We recommend that you read David Weiss’s book “A Modern Adaptation of the Wyckoff Method” and subscribe to his newsletter.
This is a special indicator that can become the best in your arsenal. But before using it, try trading on a demo account first.
Download WeisWave Indicator for MT5 for free now!
1 2 3 4 5