
VR Donchian Indicator
Forex BUY and SELL signals from the best VR Donchian Indicator. Find the overall trend’s direction.
Description
The VR Donchian Indicator is an MT4 indicator that tells about the trend’s direction. The traditional Donchian Indicator uses Moving Averages to plot three lines or bands on the chart. The VR Donchian Indicator also draws three bands on the chart. Each band mentions the current price value. The price travels between the bands so traders can take their positions accordingly.
The VR Donchian Indicator works best on all timeframes, but it is best to use the indicator on higher timeframes to avoid any market noise.
VR Donchian Indicator BUY/SELL signals

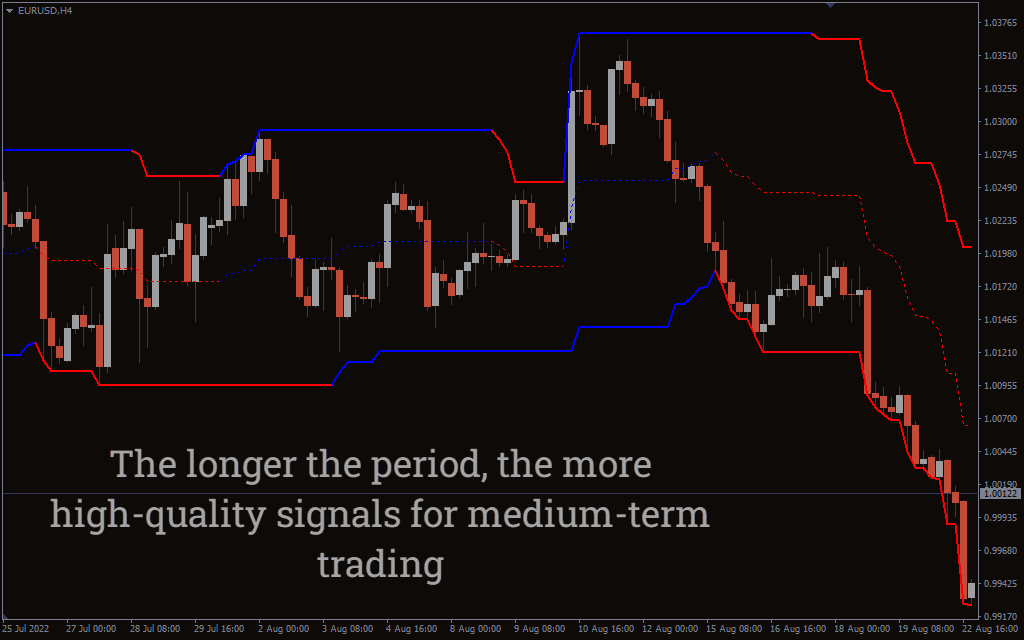
The above EUR/USD H4 chart shows the BUY and SELL signals for the indicator. To determine BUY and SELL signals, one should look at the upper and lower bands. If the price touches the lower band, it is a BUY signal, and traders can enter long. Conversely, if the price touches the upper bands, it’s a SELL signal, and traders can enter short.
The middle band act as a neutral. Traders should refrain from entering the middle band, as the price can go anywhere when it touches the middle band. The upper and lower bands also act as levels of support and resistance. So, if traders want to use the Indicator with other indicators, it’ll act as a signal confirmation.
Conclusion
The VR Donchian Indicator uses Moving Averages to plot three lines or bands on the chart. These lines act as entry and exit points. These lines also signify levels of support and resistance. By understanding the bands and overall price action, traders can enter long and short positions. Also, you can download the indicator for free on our website.

1 2 3 4 5