
TTM Indicator
The TTM indicator presents an overall picture of the trend by painting bars on the candlestick chart.
Description
The TTM indicator is a simple MT4 indicator that removes any noise in the candlestick chart.
TTM is an acronym for Trade the Market. John Carter and Hubert Senters developed the TTM indicator and presented it in their strategies.
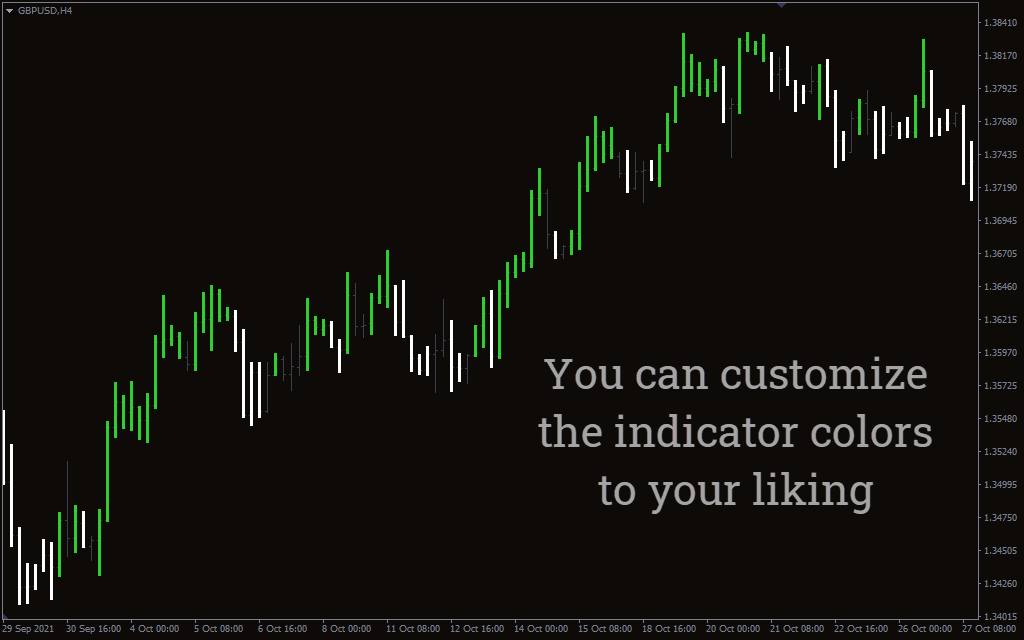
The indicator paints red and blue colors over the traditional candlesticks. The red color illustrates a downtrend, while the blue highlights an uptrend. This removes any differences occurring on the chart and presents a better picture of the overall trend.
TTM paints only those candlesticks that have a strong trend. If there isn’t a strong trend, indicator leaves the candlestick and move on to the next one.
The indicator uses a period of Heikin Ashi to paint red and blue bars. The Heikin Ashi works like a normal candlestick, except it calculates as close, open, high, and low. The normal candlestick calculates as open, high, low, and close.
The Heikin Ashi makes locating trends easier than normal candlesticks, so the TTM indicator is a great detector of trend continuation or a reversal.
How to trade the TTM indicator?
The TTM indicator is simple to use because of its overall structure. When the blue bars appear, the indicator presents a buying opportunity. Whereas the red bar presents a good selling point.
As mentioned earlier, the indicator uses Heikin Ashi’s close, open, high, and low. This helps in pointing stronger trend.
It’s important to note that you have to look for consecutive bars to enter the trade. This is because the TTM misses out on bars where the trend is low. The miss-out bars are neutral, and they pop up regularly in the trend. So the best way to decide the strong trend is to add a volume indicator with TTM.
Let’s find out the buy and sell strategy for the indicator:
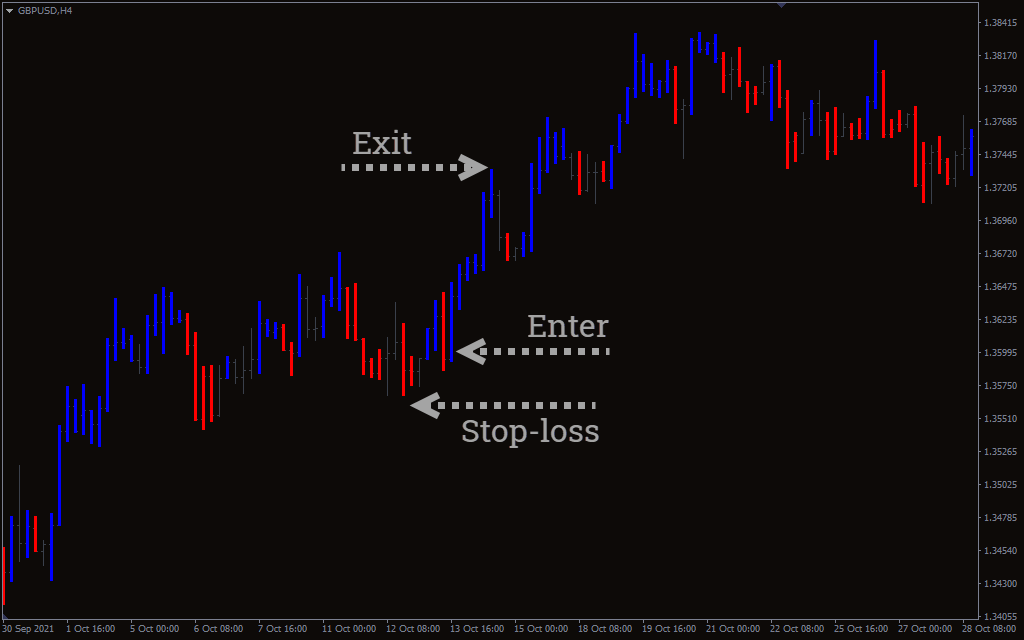
TTM indicator buy strategy
- Locate the blue bars on the chart.
- Wait for the TTM to make consecutive bars before entering.
- Enter the trade when the two consecutive blue bars appear.
- Place a stop-loss near the recent low of the buying point.
- Exit the trade when the red bar appears.
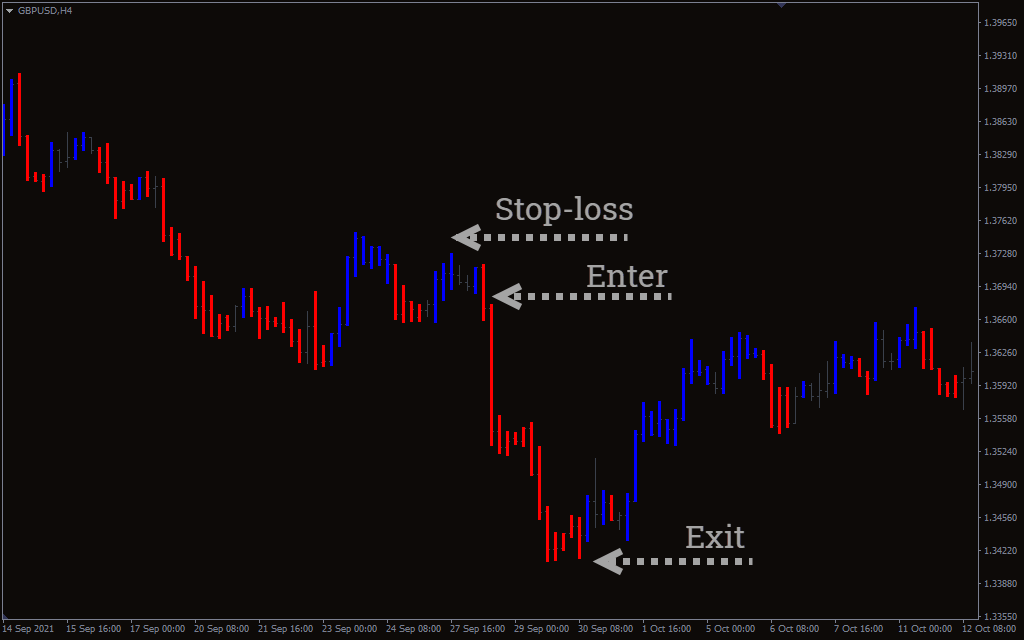
TMA indicator sell strategy
- Locate the red bars on the chart.
- Wait for the indicator to make consecutive bars before entering.
- Enter the trade when the two consecutive red bars appear.
- Place a stop-loss near the recent high of the selling point.
- Exit the trade when the blue bar appears.
Conclusion
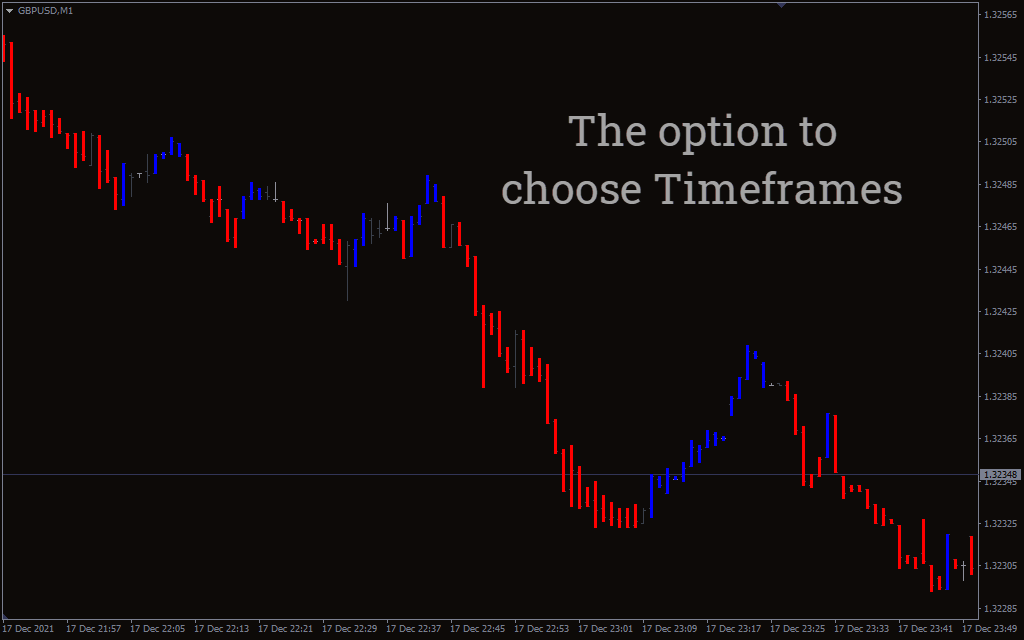
The good thing about using the TTM indicator is applying it on any timeframe. It’s simple to use and removes the market noise that appears on the regular chart.
You can also combine the indicator with any volume indicator for further trend confirmation.

1 2 3 4 5