

T3MA ALARM Indicator
The T3MA-ALARM Indicator uses the Triple Exponential Moving Average to plot arrows on the chart.
Description
The T3MA ALARM Indicator uses a moving average (MA) to detect trends and reversals in the market. The Moving Average is a widely used technical analysis tool that calculates the average price of an over a specific period.
In the case of the T3MA ALARM Indicator, it employs a type known as the Triple Exponential Moving Average (T3MA). The T3MA plots red and blue arrows to identify BUY and SELL signals.
How to use the T3MA ALARM Indicator for MT4?
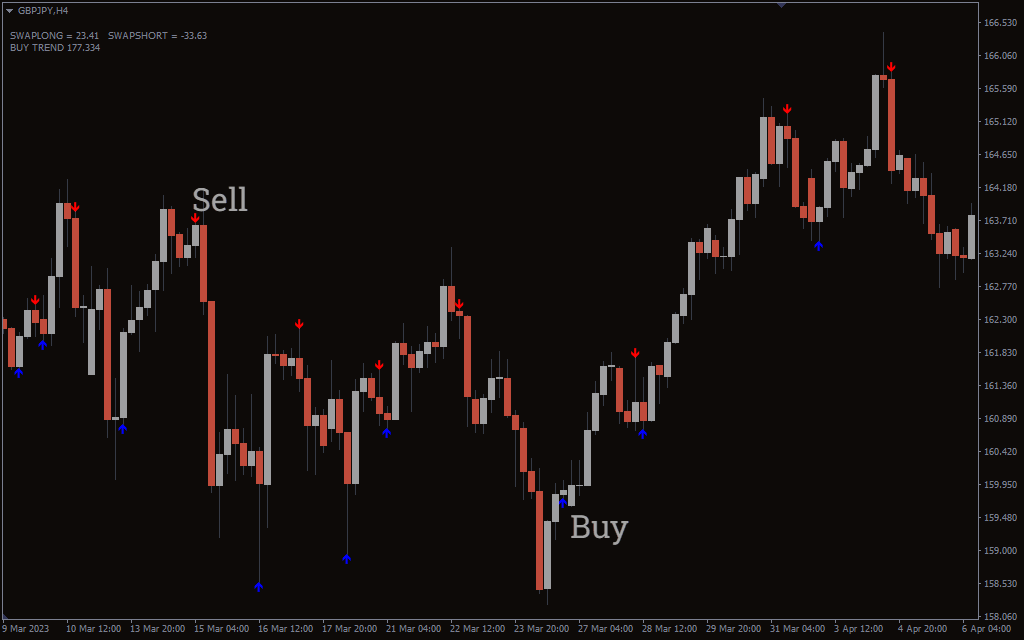
The above GBP/JPY H4 chart shows the BUY/SELL signals on the chart.
When the T3MA ALARM Indicator identifies a potential sell signal, it displays a red arrow on the price chart. Conversely, when the indicator identifies a potential buy signal, it plots a blue arrow on the price chart.
The indicator can also be used to detect market reversals. For instance, if the long-term trend is bullish, the appearance of a red arrow can suggest a short-term bearish reversal. You can also look at these arrows as an exit point.
By using the T3MA, the indicator filters out noise and provides clearer signals based on the underlying trend.
It’s important to note that while this indicator can be a useful tool in trading, it is advisable to combine its signals with other indicators.
Conclusion
The T3MA ALARM Indicator for MT4 uses the Triple Exponential Moving Average (T3MA) to plot red and blue arrow signals for potential buying and selling opportunities.
By detecting market reversals and filtering out the noise, the indicator can help identify entry and exit points.

1 2 3 4 5