
Swing Highs-Lows & Candle Patterns Indicator
Identify swing highs/lows and candlestick patterns with the Swing Highs-Lows Indicator for MT5 by LuxAlgo. Spot key reversals and trend shifts with ease.
Description
The Swing Highs-Lows & Candle Patterns Indicator for MT5, created by LuxAlgo, is a visual trading tool designed to help traders pinpoint key turning points in market structure. By automatically marking higher highs (HH), lower highs (LH), higher lows (HL), and lower lows (LL), the indicator provides a framework for understanding trend dynamics. Combined with candlestick pattern detection, this tool offers deeper context for reversals, continuations, or exhaustion setups.
Swing Highs-Lows & Candle Patterns Indicator Trading Signals

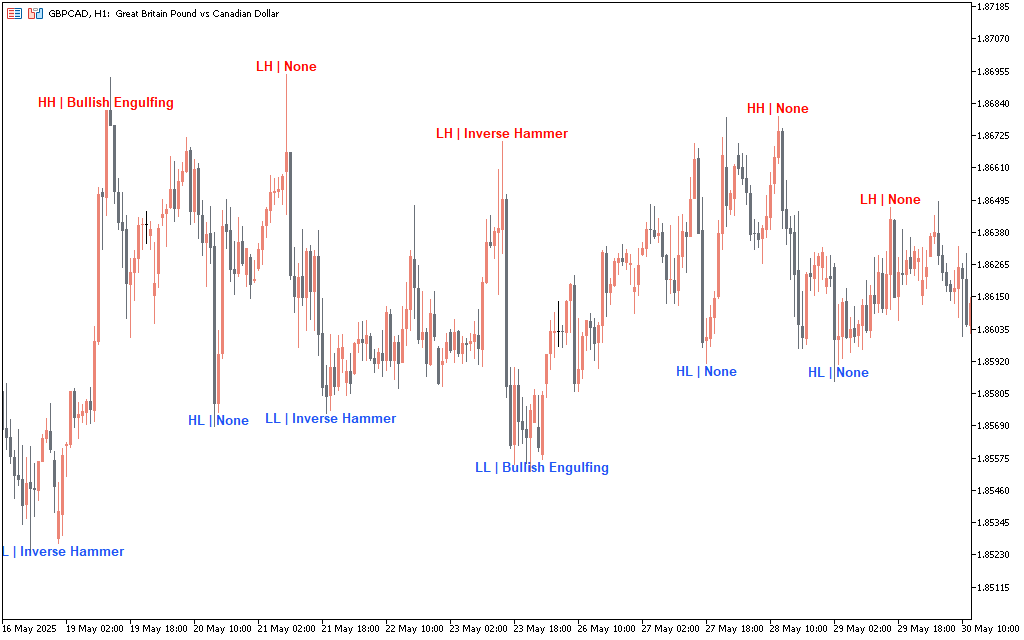
This indicator plots swing structures directly on the chart, labeling each new high or low with color-coded tags. For instance, a red “HH” marks a new higher high, while a blue “LL” highlights a fresh lower low. These labels are combined with real-time candlestick patterns such as hammers, engulfing candles, and doji formations to provide a comprehensive view of potential price reactions. If a swing high forms alongside a bearish engulfing candle, it may suggest a stronger case for a reversal. The interplay between market structure and candlestick context offers traders a reliable method to confirm price exhaustion, validate breakouts, or anticipate trend continuation.
Conclusion
The Swing Highs-Lows & Candle Patterns Indicator for MetaTrader 5 provides a simple yet powerful visual overlay for identifying structural highs and lows in price action. When combined with candlestick patterns, it becomes a valuable decision-making tool for swing traders, scalpers, and position traders alike. Whether you’re spotting double tops, confirming reversals, or gauging momentum, this indicator adds clarity to your market analysis by combining structure and candlestick behavior in a single view.

1 2 3 4 5