

Support and Resistance Radar V5 Indicator
Support and Resistance Radar V5 for MT4 automatically detects key levels across all timeframes, helping traders plan precise entries and exits.
Description
The Support and Resistance Radar V5 Indicator for MT4 is an advanced technical tool that automatically identifies and plots support and resistance levels across multiple timeframes. It’s designed for traders who want to visualize price reaction zones in a structured and data-driven way without manually marking levels on their charts.
When I first started using this indicator, I was genuinely impressed by how cleanly it mapped historical reaction zones and kept them updated in real-time. Seeing the exact levels respected across several timeframes — from M1 to MN1 — gave me a clear understanding of which areas had the highest confluence. It felt like having an automated analyst constantly marking the strongest levels for me.
Support and Resistance Radar V5 Trading Signals
This indicator doesn’t generate conventional buy or sell signals — instead, it highlights price reaction zones that often act as potential reversal or breakout points.
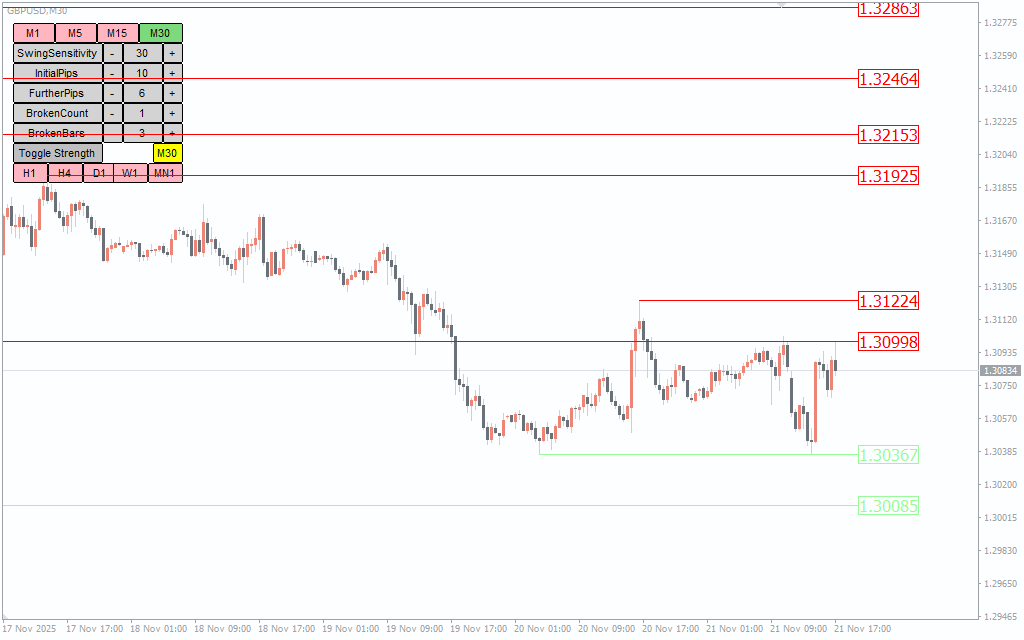
The red horizontal lines represent resistance levels, while the green ones show support zones. When price approaches a resistance, traders can monitor for possible rejections or breakouts. Conversely, approaching support levels can signal buying interest or areas to tighten stop-losses.
In practice, I use this indicator as a confirmation filter for my trading setups. For example, if my strategy generates a buy signal near a green zone on the H4 or D1 timeframe, I gain more confidence in taking the trade. Similarly, if the market is approaching a strong red level visible across several timeframes, I know to avoid entering too late into an extended move.
The real magic happens when levels align across multiple timeframes — that’s where price tends to react most sharply.
Conclusion
The Support and Resistance Radar V5 Indicator for MT4 is an essential tool for traders who rely on market structure and price zones. It automatically identifies significant areas where price is likely to react, providing clarity for both short-term scalpers and long-term swing traders.
From my experience, this indicator dramatically improves situational awareness — you instantly see where the market is likely to stall, reverse, or accelerate. Whether used alone or alongside other technical tools, it’s a reliable ally for navigating market volatility.

1 2 3 4 5