
Sidus Indicator
Forex market BUY/SELL signals from the best Sidus Indicator for MT4. Find out the trend direction with the help of arrows.
Description
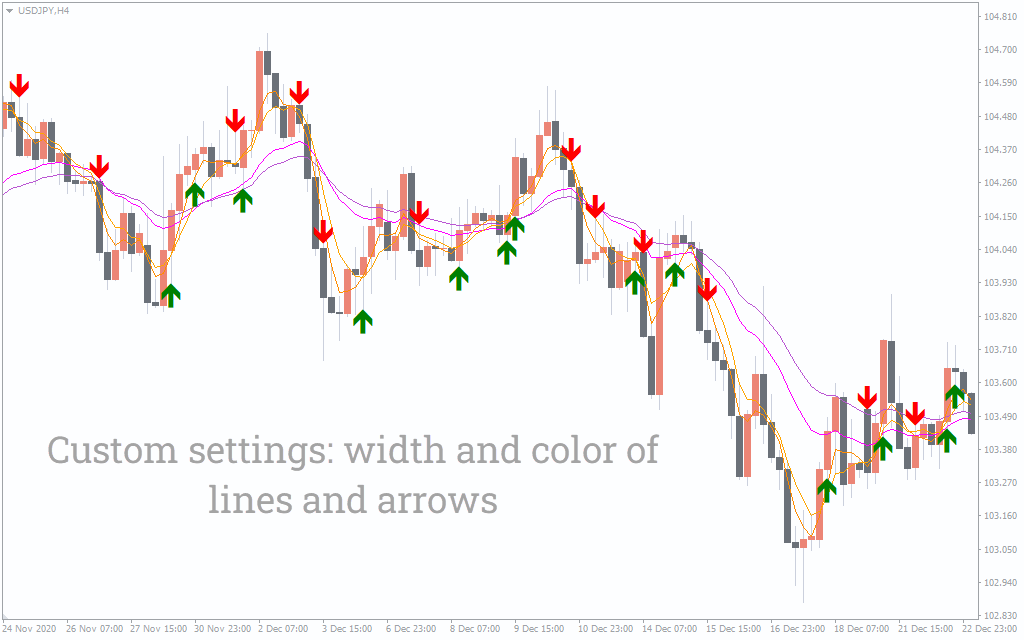
The Sidus Indicator is a simple MT4 indicator that plots arrows and Moving Averages to tell the direction of the trend. There are two main components of the indicator; Moving Averages and arrows. The indicator plots four MAs ranging from shorter periods to longer ones. Although the indicator doesn’t specify MA periods in its settings, they appear on the chart.
The next aspect of the Sidus Indicator is the arrows. There are two different arrows; green and red. The green arrow suggests an uptrend, while the red arrow mentions a downtrend. The arrows and the MA act as signal confirmations.
The Sidus Indicator works on every time timeframe; however, as the MAs are prone to false signals and rely on historical data, it’s better to look at the trend on a longer timeframe. If you are a scalper or a short-term trader, you can look for the overall trend on a longer timeframe, and then come to a shorter timeframe to enter the trade.
How to use the Sidus Indicator for MT4?
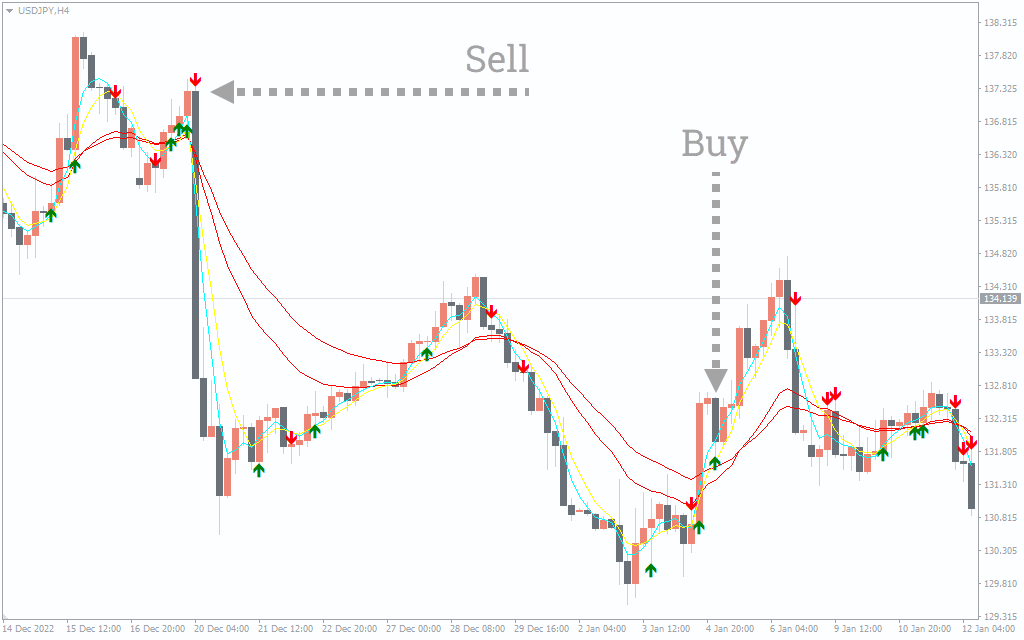
The above USD/JPY H4 chart shows the Sidus Indicator’s BUY/SELL signals. There are two ways of finding BUY/SELL signals with the indicator. The simplest approach is to look for green or red arrows. You can take a short position when the red arrows appear, while when the green arrow emerges, you can go long.
However, this approach can be faulty, as these arrows frequently appear on the chart, and aren’t a good indicator of BUY/SELL signals. Also, these arrows can repaint, meaning the arrow can appear when the candle is forming but can disappear when its formation is complete. The next method of using the Sidus Indicator combines the MAs and the arrows. When the price goes below all the MAs, and there is a red arrow, you can take a short position. On the other hand, when the price goes above the MAs, and there is a green arrow, you can take long positions.
It’s important to wait for the trend to form and then enter as the arrows can repaint and the price can jump above or below the moving averages. Although the additions of the MAs with arrows act as confirmation, you can add other forms of technical analysis like finding candlestick/chart patterns or using other indicators like the RSI or MACD for further confirmation.
Conclusion
The Sidus Indicator for MT4 applies arrows and moving averages to determine the trend strength. The arrows and the MAs act as signal confirmations making it easier to enter and exit the trade. If you want to download the Sidus Indicator, you can do it free from our website.

1 2 3 4 5