
RSIMA Baseline Divergence Indicator
RSIMA Baseline Divergence plots the best crossover trend signals on forex and stock charts.
Description
The RSIMA Baseline Divergence represents a unique MT4 indicator that accurately filters solid divergence signals. It helps assess potential trend reversals using crossovers between the relative strength index and baseline moving average.
Apart from divergences, it also generates overbought/oversold signals, enabling you to add more confluence to your trading decisions. Novice to experts, anyone can read and follow RSI abd MA baseline divergence signals.
This guide will explain how easily you can trade solid divergence setups using this indicator in MT4.
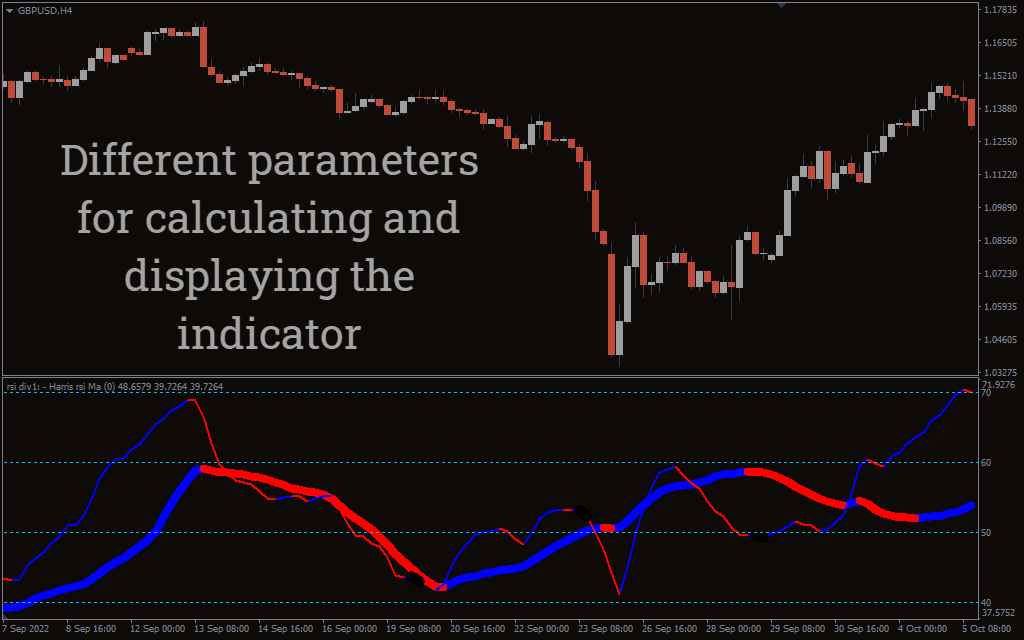
RSIMA Baseline Divergence Indicator for MT4
This indicator plots trend reversal signals whenever it detects an opposite behavior between price actions and RSI movement.
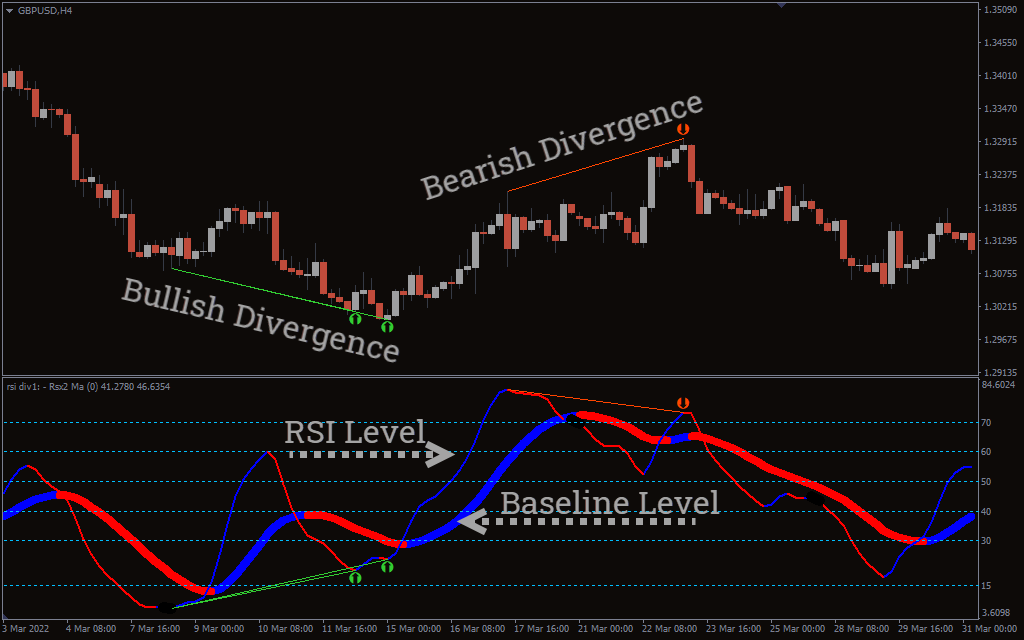
Interestingly, this indicator adds a baseline MA to plot crossover signals with RSI and filter the divergence signals. Both indicator levels turn blue during a bullish crossover and become red to signal a bearish crossover.
A bullish divergence with the RSI below 30 (oversold zone) indicates a buy signal. Contrarily, look to sell on bearish divergences while the RSI hits the overbought zone (70).
Conclusion
The RSIMA Baseline Divergence is one of the best MT4 indicators for detecting bullish/bearish divergence signals. It helps you place buy-sell orders at the right trend-reversal points and earn a better profit margin. Also, this divergence indicator suits both trend-following and counter-trend trading strategies.

1 2 3 4 5