
Price Action Scaner Indicator
The Price Action Scaner is a logical and simple indicator for an Expert Advisor (EA), which can show trend reversals and its continuation.
Description
By default, MT5 unfortunately does not have any indicators that can analyze charts using the default Price Action method.
The Free Price Action Scaner indicator will help you solve this problem. We invite you to read its description in our article.
Contents:
1. Why use Price Action
2. Price Action Scaner indicator and its features.
1. Why use the Price Action Scaner
Price Action is a chart analysis method that uses only primary data – the market price – to make trading decisions. This approach involves the use of price models as the main tools.
The reverse method of chart analysis comes down to the use of technical analysis indicators, as well as trading robots and advisors (EA). They process price and volume data and generate trading signals based on this.
Both of these approaches are quite effective and can be useful for Forex trading. However, although MT5 has a large number of indicators of the second group, MT5 has practically no Price Action tools.
2. Price Action Scaner indicator and its capabilities
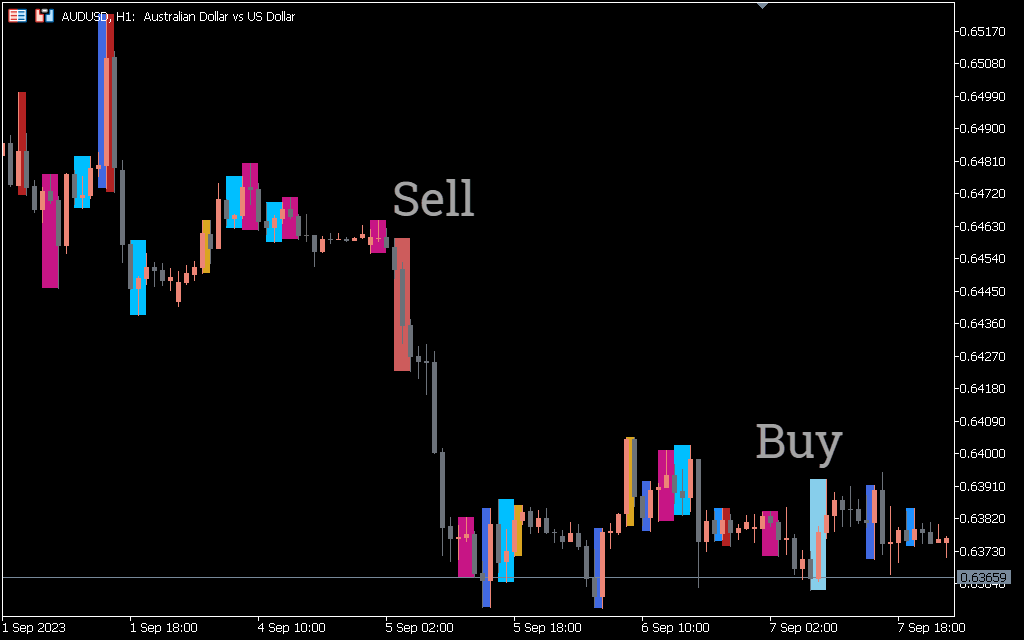
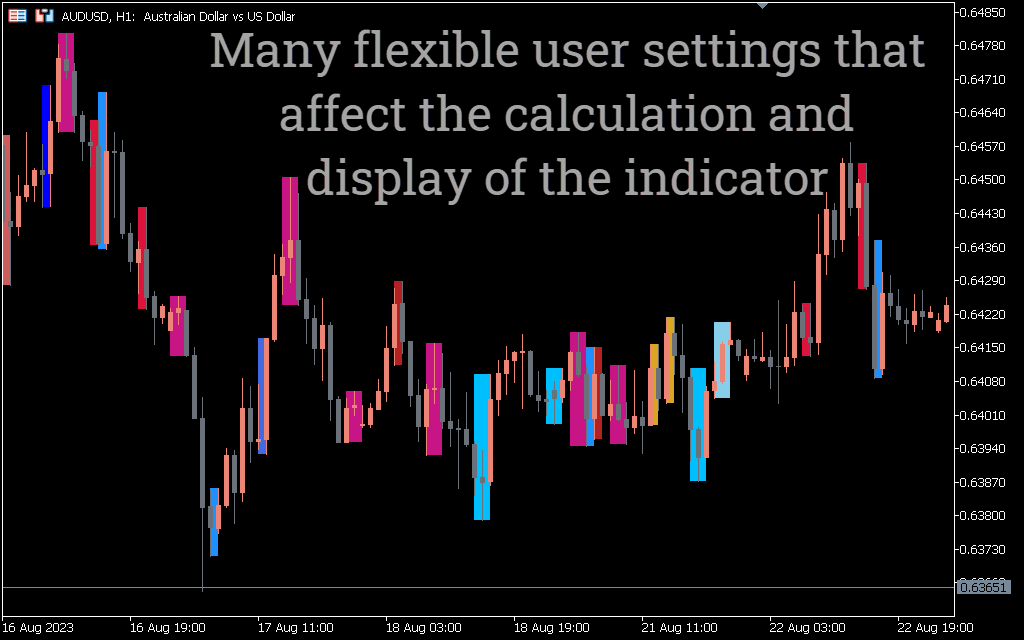
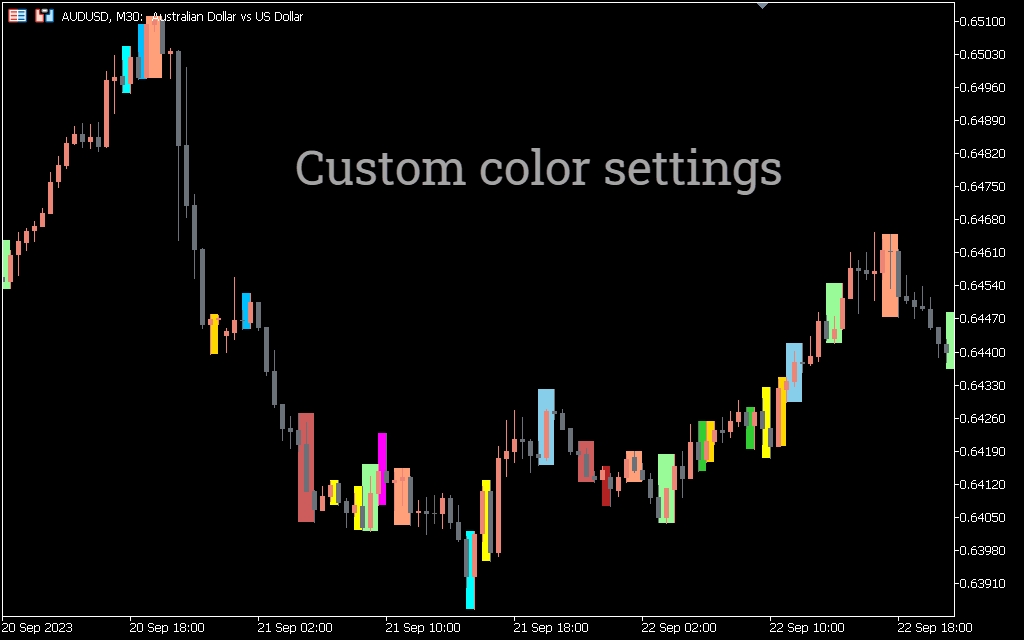
Price Action Scaner is a free MT5 indicator that analyzes the chart of a selected asset and automatically displays certain price patterns (settings) on it.
Price Action Scaner draws price patterns on all timeframes of the MT5 terminal. When using it, you should take into account the priority of timeframes. The higher the timeframe, the less market noise will be taken into account and the more accurate the signals will be.
The indicator includes a total of 7 Price Action patterns:
- DBHLC & DBLHC pattern (double bar lows with higher close and double bar highs with lower close) or bullish/bearish setup.
- TBH&TBL model (two bars of high and two bars of low) or two bars with the same price of high and low.
- RAIL template.
- OVB pattern (bullish pattern and bearish pattern) or engulfing pattern.
- PPR (Point of Reversal) or Pivot Point Model.
- Pin bar pattern or pin bar.
- WRB (wide band) or widening band pattern.
As we know, market points are more reliable when multiple analysis tools suggest opening a position. Thus, the price activity indicator will be more useful when used with other indicators or the main trading system.
When you use the indicator for the first time, you will have to spend some time setting up its parameters.
Conclusion
The Price Action Scaner indicator can ultimately become a useful addition to your Forex trading system.
The indicator draws patterns on all timeframes, which makes it more universal. So, no matter what approach you take to trading (swing trading, scalping, day trading or long-term trading), the chart will always show trading situations that promise profit.
1 2 3 4 5