
Previous Highs & Lows Indicator
Download the Previous Highs & Lows Indicator for MT5. Track daily highs and lows with adjustable zones and gradient visualization for better trading decisions.
Description
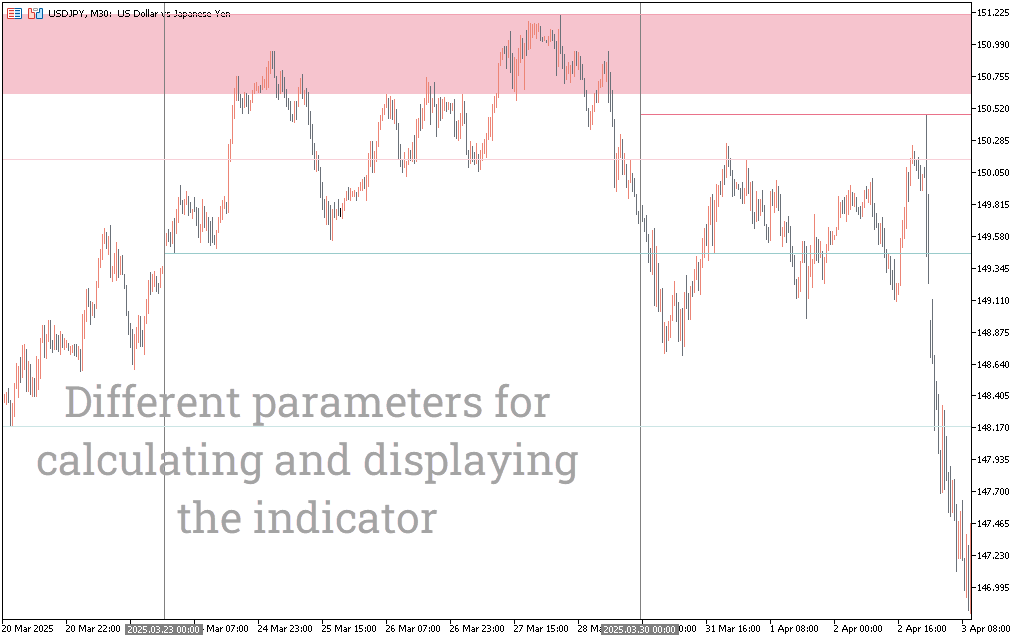
The Previous Highs & Lows Indicator for MetaTrader 5, developed by LuxAlgo, is a smart tool designed to help traders automatically plot historical high and low levels on the chart. These key price levels often act as zones of support and resistance, making them essential for technical analysis. This indicator provides real-time visual mapping of the most recent price extremes, helping you spot potential breakout and rejection points quickly and clearly. Whether you’re using it to scalp or swing trade, this tool adds a layer of precision to your chart analysis.
Previous Highs & Lows Trading Signals
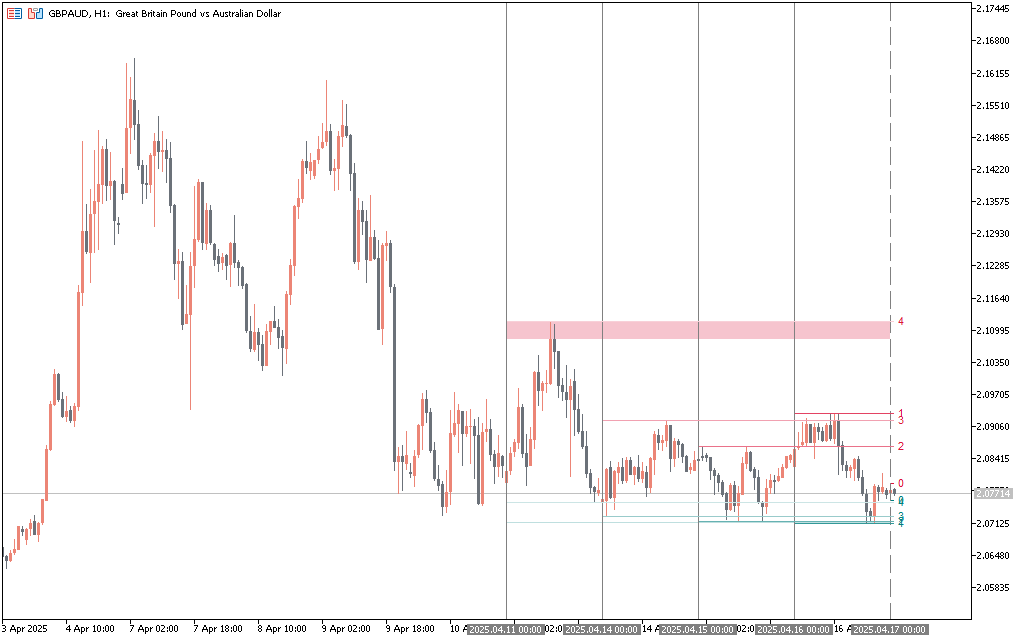
The Previous Highs & Lows Indicator does not generate buy or sell arrows. Instead, it provides visual reference levels derived from recent price action. When the price approaches previous highs, traders may anticipate resistance or potential breakout opportunities. Similarly, retests of prior lows can act as support zones or breakdown confirmation points. The color-coded zones and lines help distinguish between bullish and bearish ranges, with shaded regions enhancing visibility of potential entry or stop areas. By aligning trades near these plotted levels, traders can improve risk-reward ratios and better manage position timing.
Conclusion
The Previous Highs & Lows Indicator for MT5 by LuxAlgo is a clean and intuitive tool for marking essential price levels directly on your chart. It doesn’t clutter your screen with noise—just the historical levels that matter most. Perfect for price action traders and technical analysts, it helps identify key reaction points for better timing and risk control. Whether you’re trading trend continuations or reversals, this indicator provides a valuable edge by highlighting where the market has previously made critical moves.

1 2 3 4 5