
Precision Trend Histogram Indicator
Forex BUY and SELL signals on the best Precision Trend Histogram for MT5. Find the direction of the trend.
Description
The Precision Trend Histogram is a simple MT5 indicator that reports the direction of a trend. The indicator builds a histogram below the chart in the lower window.
The histogram consists of orange and green bars. The color of the bars indicates the direction of the trend.
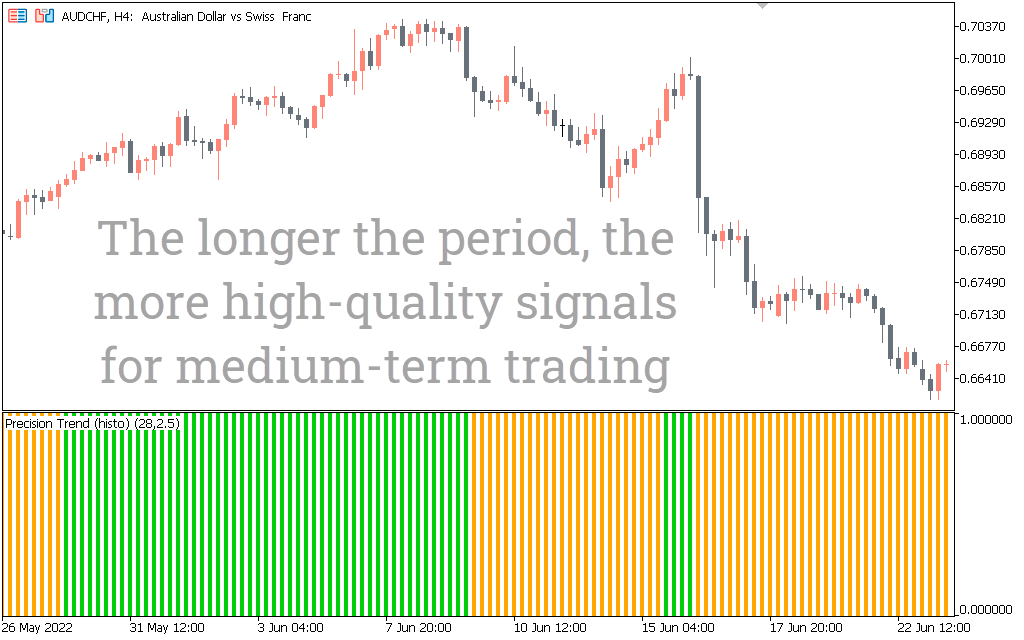
Traders can apply the indicator on any time frame; however, it is best to apply it on longer timeframes to filter out any false signals.
Precision trend histogram for MT5 BUY/SELL signals
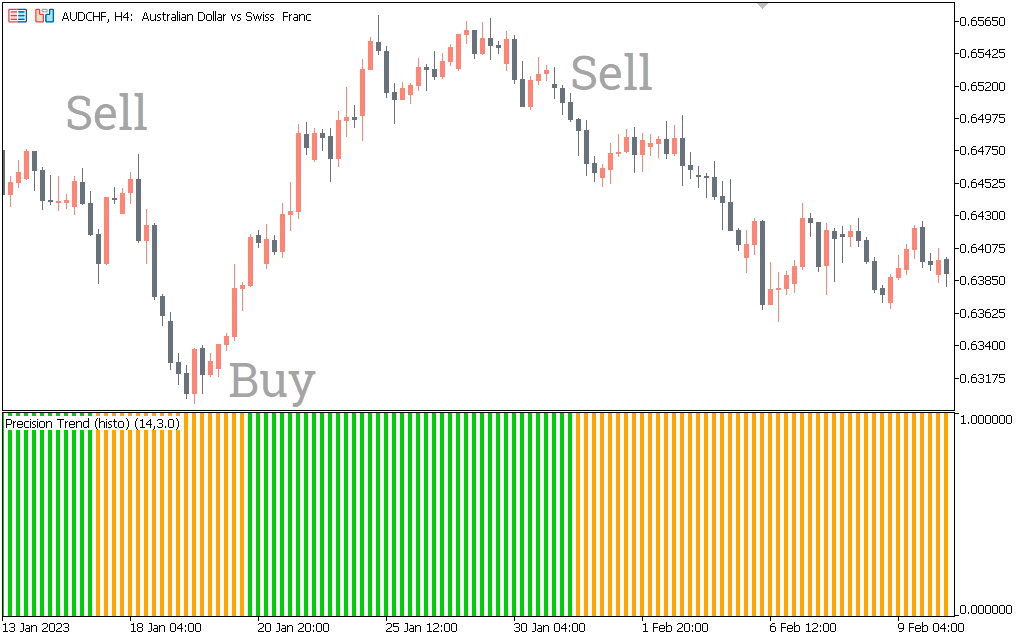
The above AUD/CHF H4 chart shows the indicator’s BUY and SELL signals. To look for BUY and SELL signals, traders should look at the color of the bars. The indicator is building orange bars in a strong downtrend and traders can go short. Conversely, when the indicator draws green bars, it indicates an uptrend and traders can open long positions.
Traders can also use the indicator to look for market reversals. When the indicator starts to change color, it indicates that the trend is coming to an end and traders need to exit trades. It is important to note that sometimes the indicator does not mention trend reversals, so traders have to wait for the price action to change course and exit trades.
The indicator works best on its own, but traders can use other indicators to further confirm the signal.
Conclusion
Trend Histogram Precision plots a histogram consisting of orange and green bars. Looking at the orange and green bars, traders can open positions or exit trades. If you want to download the Precision Trend Histogram, you can download the indicator for free on our website.
1 2 3 4 5